MACD Indicator Driven OBV Quant Trading Strategy
Author: ChaoZhang, Date: 2024-01-17 18:01:36Tags:

Overview
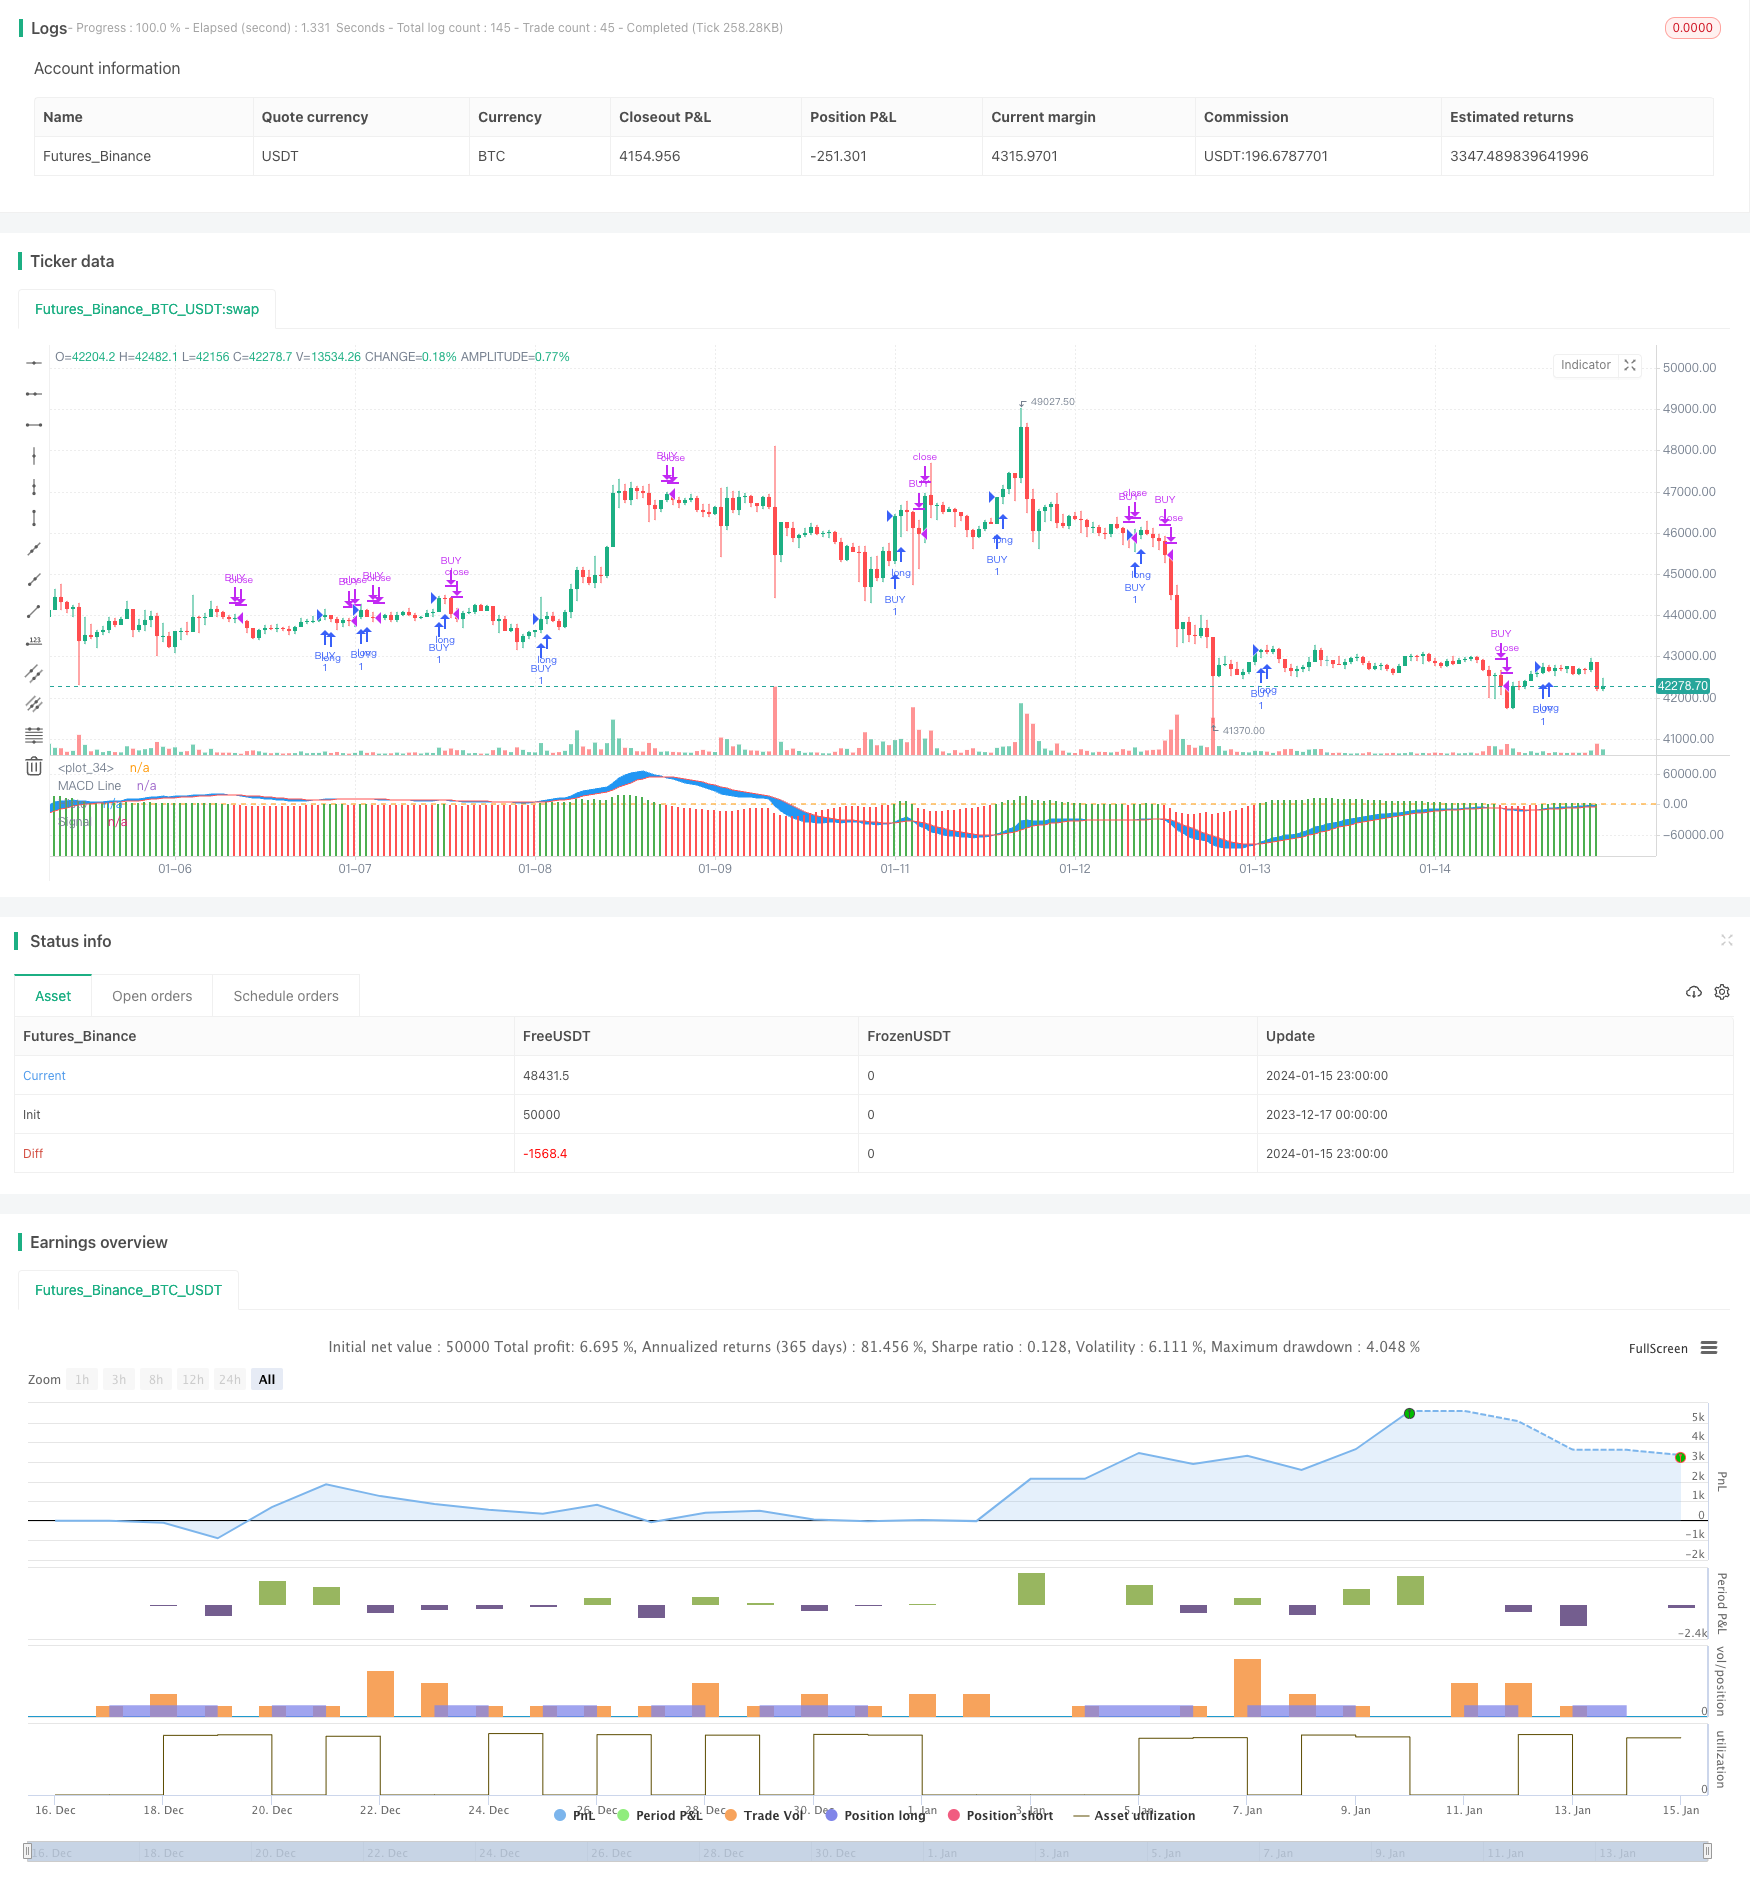
This strategy generates trading signals by calculating the MACD indicator of the OBV indicator to determine the trend and inflection points of OBV momentum. The core idea is to generate buy signals when the OBV MACD histogram breaks through the 0-axis from the negative region to the positive region, and to generate sell signals when it breaks through the 0-axis from the positive region to the negative region.
Strategy Principle
The core indicator of this strategy is the MACD indicator of OBV. The OBV indicator can reflect the momentum trend of a stock by statistically analyzing the relationship between the changing directions of closing prices and trading volumes over a period of time to determine whether the upward momentum is strengthening or weakening. The MACD indicator shows the difference between different moving averages to reflect the momentum of price changes. Therefore, by combining the OBV momentum indicator and the MACD momentum indicator, the change trend of momentum can be more clearly judged.
Specifically, this strategy first calculates the OBV indicator, which calculates the OBV momentum line by statistically analyzing the relationship between the changing directions of closing prices and trading volumes over a period of time. Then, based on the OBV momentum line, its MACD indicator is calculated, including the MACD line, signal line and histogram. Finally, when the macd histogram breaks through the 0-axis from the negative region to the positive region, a buy signal is generated; when the histogram breaks through the 0-axis from the positive region to the negative region, a sell signal is generated.
By this means, the MACD intuitively displays the momentum characteristics of the OBV volume, and judges the trend of volume changes. The penetration of MACD is used to issue transaction signals, which can improve the accuracy of transaction decisions.
Advantage Analysis
This strategy combines OBV volume analysis and MACD momentum indicators for relatively accurate judgments on volume and price trend changes, which can effectively filter out FALSE signals. The specific advantages are:
- OBV indicator can determine the strength contrast between buyers and sellers and the trend of volume changes
- MACD histogram can clearly identify the inflection points of OBV momentum
- Trading signals are clear and less likely to misjudge
- There are more configurable trading parameters and the trading rules are clear
Risk Analysis
The strategy also has some risks, mainly in the following aspects:
- Both OBV and MACD are sensitive to trading volume. Abnormal high trading volumes can be misleading
- Improper Parameters settings may also affect strategy performance
- When switching between long and short, OBV volume changes may lag, resulting in lagging trading signals
To cope with these risks, the following measures can be taken:
- Filter out abnormal data by screening trading volumes
- Set parameters prudently and take market conditions into consideration
- Properly adjust parameter settings such as MACD cycles to generate timely trading signals
Optimization Directions
There is still room for further optimization of this strategy, mainly in the following directions:
- Combine with other indicators for portfolio trading to improve strategy performance
- Add stop-loss mechanisms to control risks
- Optimize parameter settings to meet the needs of different market environments
By continuous testing and optimization, this strategy can become a stable and efficient quantitative trading strategy.
Summary
This strategy is a typical quantitative strategy that combines volume analysis and momentum indicators to determine price trends and generate trading signals. It can clearly identify the inflection points of price fluctuations, and the trading signals are relatively reliable. With reasonable parameter settings, good strategy results can be obtained. But it also has some risks that need to be reduced by continuous optimization to improve performance. In general, this strategy provides a typical idea for quantitative trading strategies which is worth researching and applying.
/*backtest
start: 2023-12-17 00:00:00
end: 2024-01-16 00:00:00
period: 1h
basePeriod: 15m
exchanges: [{"eid":"Futures_Binance","currency":"BTC_USDT"}]
*/

//@version=3

strategy(title = "MACD of OBV", overlay = false)

//////////////////////// OBV ///////////////////////////

src = close
obv = cum(change(src) > 0 ? volume : change(src) < 0 ? -volume : 0*volume)


//////////////////////// OBV   //////////////////////////

//////////////// MACD OF OBV ////////////////////////////

sourcemacd = obv

fastLength = input(12, minval=1), slowLength=input(26,minval=1)
signalLength=input(9,minval=1)


fastMA = ema(sourcemacd, fastLength)
slowMA = ema(sourcemacd, slowLength)

macd = fastMA - slowMA
signal = ema(macd, signalLength)
delta=macd-signal

swap1 = delta>0?green:red

plot(delta,color=swap1,style=columns,title='Histo',histbase=0,transp=20)
p1 = plot(macd,color=blue,title='MACD Line')
p2 = plot(signal,color=red,title='Signal')
fill(p1, p2, color=blue)
hline(0)


/////////////////////////MACD OF OBV //////////////////////////


// Conditions


longCond = na
sellCond = na
longCond :=  crossover(delta,0)
sellCond :=  crossunder(delta,0)


monthfrom =input(6)
monthuntil =input(12)
dayfrom=input(1)
dayuntil=input(31)


if (  longCond )
    strategy.entry("BUY", strategy.long, stop=close, oca_name="TREND",  comment="BUY")

else
    strategy.cancel(id="BUY")


if ( sellCond  )

    strategy.close("BUY")
- Weekly Breakthrough Moving Average Trading Strategy
- RSI+Bollinger Bands Breakout Strategy at Lower Area
- Parabolic SAR, Stoch and Security Indicator Based Multi-Timeframe Quantitative Trading Strategy
- Gold Fast Breakthrough EMA Trading Strategy
- Dual-Factor Momentum Tracking Reversal Strategy
- Momentum Reversal Trading Strategy
- Bollinger Band and RSI Mixing with DCA Strategy
- Emma Pullback Short Strategy
- NoroBands Momentum Position Strategy
- Dual Confirmation Reversal Trend Tracking Strategy
- Dollar Cost Averaging After Downtrend Strategy
- Triple Indicators Sentiment Driven Breakout Strategy
- A Trend Reversal Strategy Based on Moving Averages, Price Patterns and Volume
- Dual Moving Average Strategy
- Momentum Moving Average Crossover Trading Strategy
- Dual Moving Average Golden Cross Strategy
- Momentum Wave Bollinger Bands Trend Strategy
- Reverse Momentum Trading Strategy
- Bandpass Mean PB Indicator Strategy
- RSI & Fibonacci 5-Minute Trading Strategy