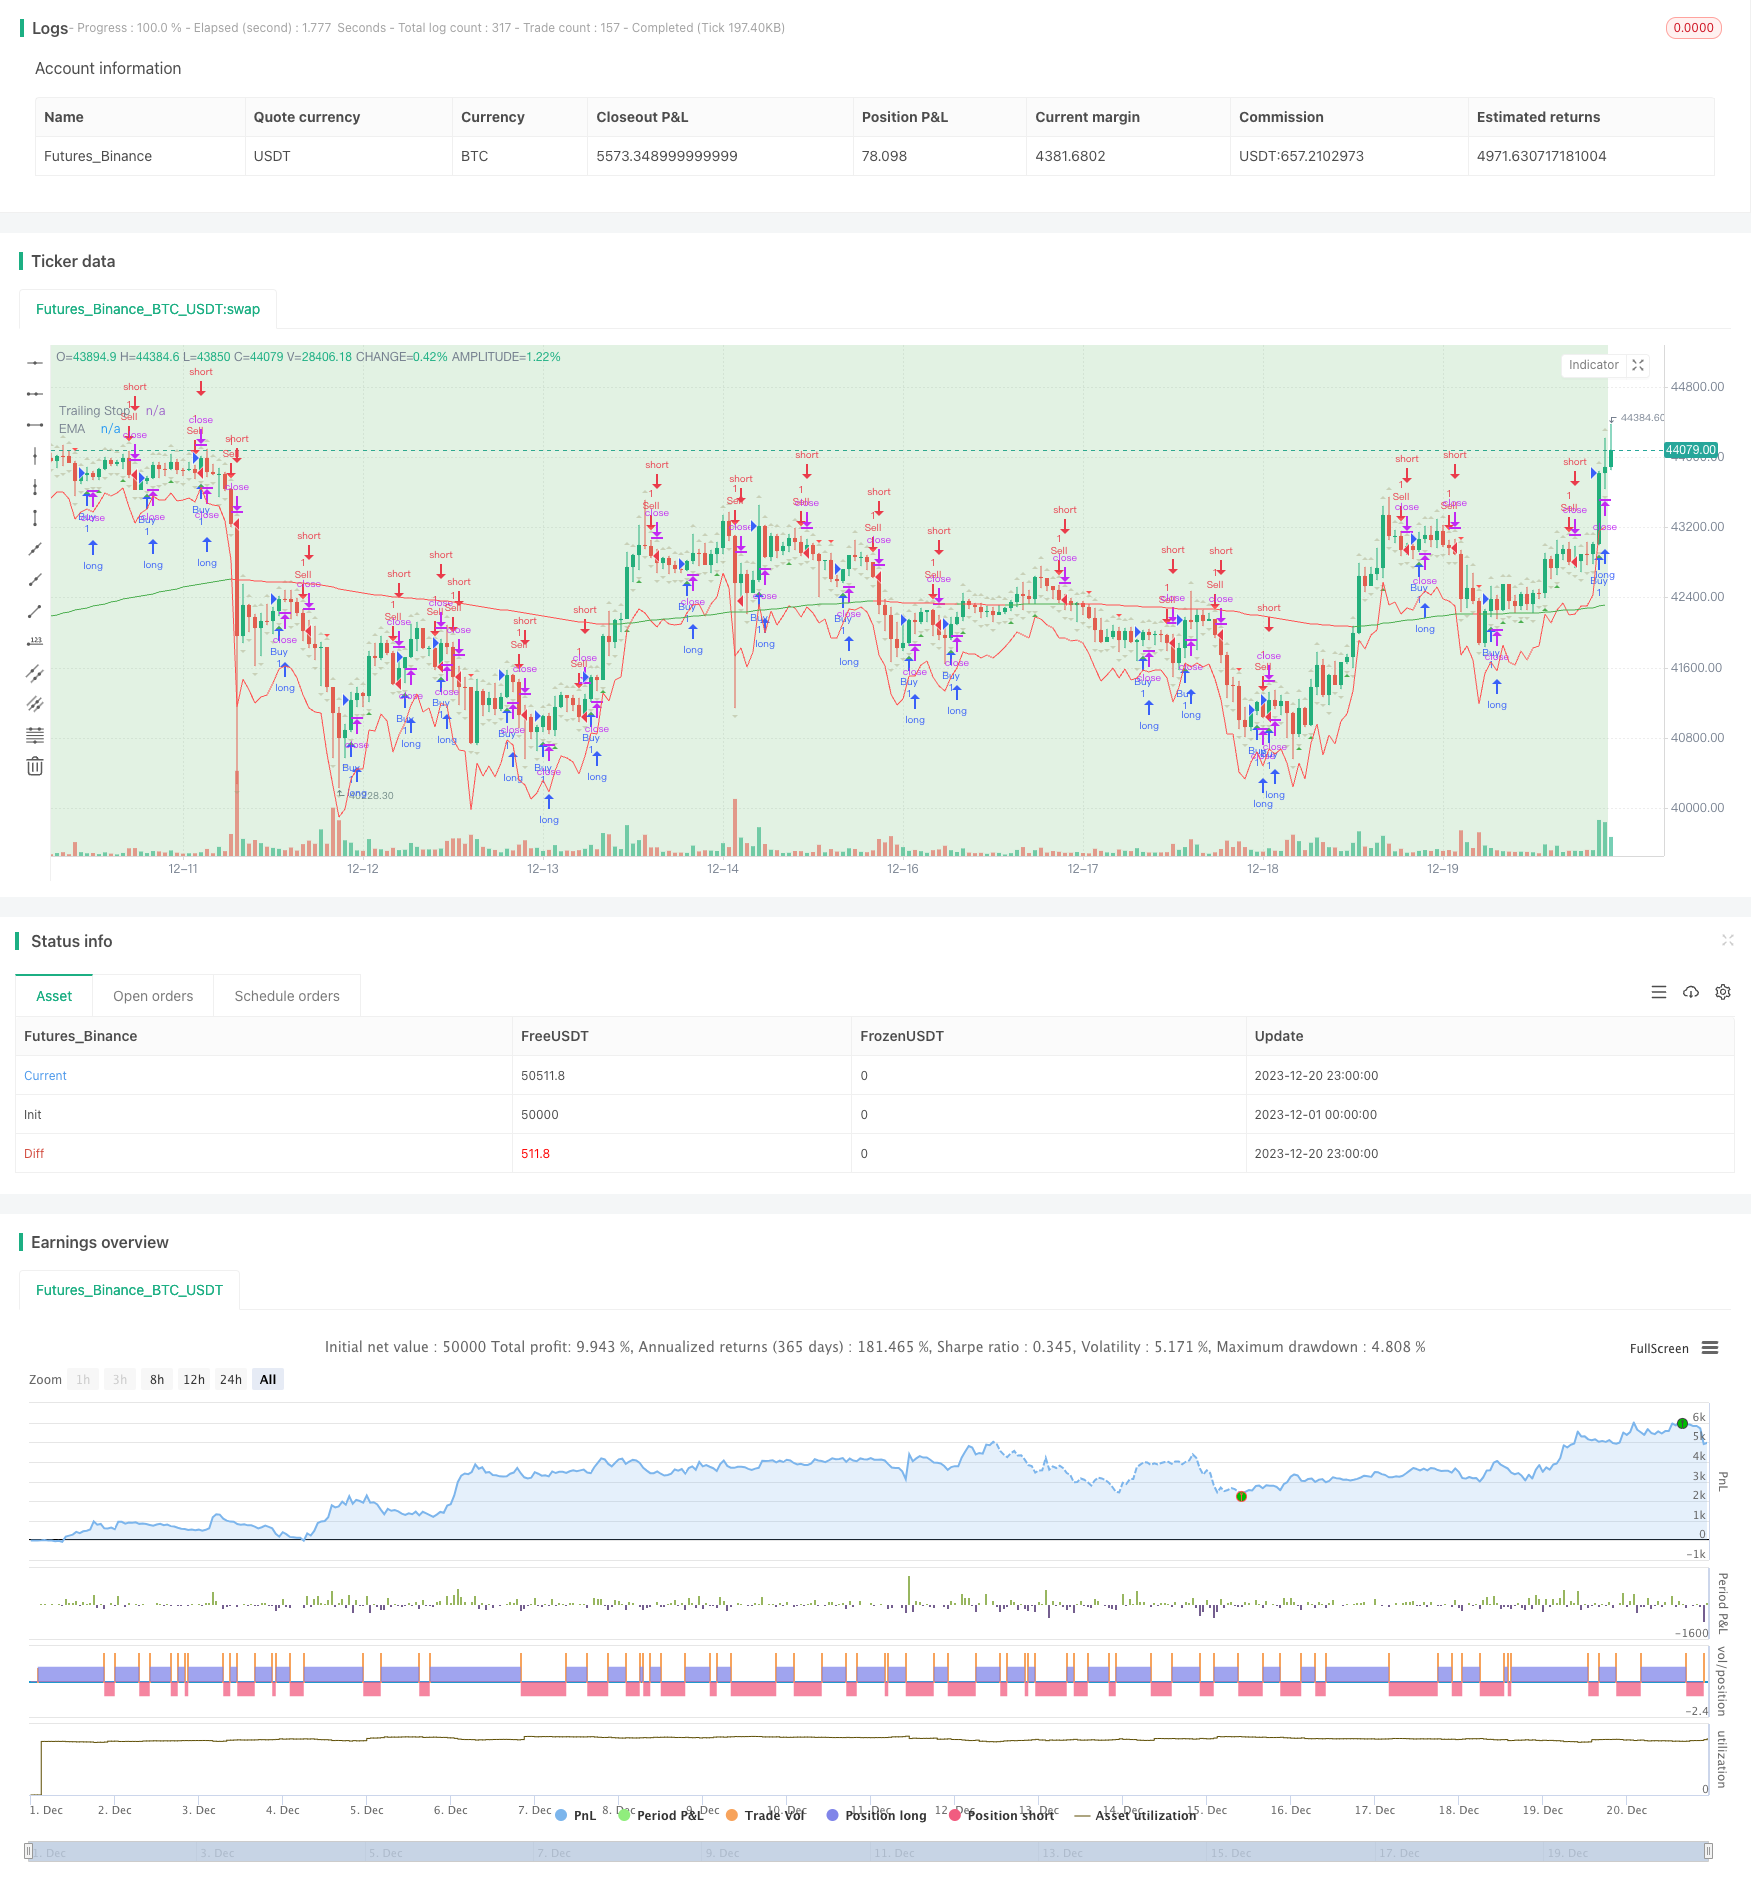
Overview
This strategy combines momentum indicators and moving averages to identify market trends and reversal points for trading when the trend changes direction. It belongs to trend following and countertrend trading strategies. The main components include supply and demand zones, EMA, various HH, LL, LH, HL long and short zones, ATR trailing stop loss etc.
Strategy Logic
1. Supply and Demand Identification
Distinguish supply and demand relationship based on high and low range of Kline. Red areas indicate supply exceeds demand supply zones. Green areas indicate demand exceeds supply demand zones.
2. EMA Trend Judgement
Plot 200 period EMA and determine uptrend and downtrend by comparing price with EMA. Price above EMA is considered as uptrend, while price below EMA as downtrend.
3. Long and Short Zone Marking
Determine reversal zones based on recent 2 candle’s high and low points: - HH Zone (Higher High Zone) - Consecutive 2 candle highs make higher high - LL Zone (Lower Low Zone) - Consecutive 2 candle lows make lower low - LH Zone (Lower High Zone) - Recent higher high reversing into lower high - HL Zone (Higher Low Zone) - Recent lower low reversing into higher low
4. ATR Trailing Stop Loss
Calculate 14 period ATR value which will be multiplied by a factor of 2 to derive the stop loss level.
5. Entry and Stop Loss Exit
Monitor price relationship with previous candle’s high/low points. Long signal triggers when price breaks above previous high. Short signal triggers when price breaks below previous low. Delay entry signal confirmation until the 3rd candle to avoid false signals. Exit with stop loss when price pulls back beyond the ATR trailing stop loss level.
Advantage Analysis
- Utilize multiple indicators to identify trend and key reversal areas to improve profitability rate.
- ATR stop loss can effectively limit per trade loss risk.
- Delayed entry signal confirmation minimizes false trading.
Risk Analysis
- Rely solely on technical indicators without considering fundamental information may lead to trading failures from missing key data.
- ATR stop loss may get run-over during huge volatility resulting in losses.
- Frequent EMA reversal signals during ranging markets can lead to over-trading.
Risk Solutions:
1. Complement with economic data and policy judgements.
2. Allow wider buffer for ATR multiplier coefficient.
3. Adjust ATR period parameter to avoid sensitivity during ranges.
Enhancement Opportunities
- Complement with technical indicators like MACD, RSI etc to improve timing.
- Backtest different period and multiplier parameter combinations for optimization.
- Consider adding re-breakout filter to avoid signal whipsaws.
- Employ machine learning etc to dynamically optimize parameters.
Conclusion
This strategy combines supply/demand analysis, trend determination, reversal identification and risk management modules effectively to spot market reversal opportunities at key areas. It is a robust system for trend following and countertrend setups. Continuous testing, optimization and human experience judgements are crucial for long term steady profits.
/*backtest
start: 2023-12-01 00:00:00
end: 2023-12-20 23:59:59
period: 1h
basePeriod: 15m
exchanges: [{"eid":"Futures_Binance","currency":"BTC_USDT"}]
*/

//@version=5
strategy("Supply and Demand Zones with EMA and Trailing Stop", shorttitle="SD Zones", overlay=true)

showBuySignals = input(true, title="Show Buy Signals", group="Signals")
showSellSignals = input(true, title="Show Sell Signals", group="Signals")
showHLZone = input(true, title="Show HL Zone", group="Zones")
showLHZone = input(true, title="Show LH Zone", group="Zones")
showHHZone = input(true, title="Show HH Zone", group="Zones")
showLLZone = input(true, title="Show LL Zone", group="Zones")

emaLength = input(200, title="EMA Length", group="EMA Settings")
atrLength = input(14, title="ATR Length", group="Trailing Stop")
atrMultiplier = input(2, title="ATR Multiplier", group="Trailing Stop")

// Function to identify supply and demand zones
getZones(src, len, mult) =>
    base = request.security(syminfo.tickerid, "D", close)
    upper = request.security(syminfo.tickerid, "D", high)
    lower = request.security(syminfo.tickerid, "D", low)
    multiplier = request.security(syminfo.tickerid, "D", mult)
    zonetype = base + multiplier * len
    zone = src >= zonetype
    [zone, upper, lower]

// Identify supply and demand zones
[supplyZone, _, _] = getZones(close, high[1] - low[1], 1)
[demandZone, _, _] = getZones(close, high[1] - low[1], -1)

// Plot supply and demand zones
bgcolor(supplyZone ? color.new(color.red, 80) : na)
bgcolor(demandZone ? color.new(color.green, 80) : na)

// EMA with Linear Weighted method
ema = ta.ema(close, emaLength)

// Color code EMA based on its relation to candles
emaColor = close > ema ? color.new(color.green, 0) : close < ema ? color.new(color.red, 0) : color.new(color.yellow, 0)

// Plot EMA
plot(ema, color=emaColor, title="EMA")

// Entry Signal Conditions after the third candle
longCondition = ta.crossover(close, high[1]) and (bar_index >= 2)
shortCondition = ta.crossunder(close, low[1]) and (bar_index >= 2)

// Trailing Stop using ATR
atrValue = ta.atr(atrLength)
trailStop = close - atrMultiplier * atrValue

// Strategy Entry and Exit
if (longCondition)
    strategy.entry("Buy", strategy.long)
    strategy.exit("TrailStop", from_entry="Buy", loss=trailStop)

if (shortCondition)
    strategy.entry("Sell", strategy.short)
    strategy.exit("TrailStop", from_entry="Sell", loss=trailStop)

// Plot Entry Signals
plotshape(series=showBuySignals ? longCondition : na, title="Buy Signal", color=color.new(color.green, 0), style=shape.triangleup, location=location.belowbar)
plotshape(series=showSellSignals ? shortCondition : na, title="Sell Signal", color=color.new(color.red, 0), style=shape.triangledown, location=location.abovebar)

// Plot Trailing Stop
plot(trailStop, color=color.new(color.red, 0), title="Trailing Stop")

// Plot HH, LL, LH, and HL zones
plotshape(series=showHHZone and ta.highest(high, 2)[1] and ta.highest(high, 2)[2] ? 1 : na, title="HH Zone", color=color.new(color.blue, 80), style=shape.triangleup, location=location.abovebar)
plotshape(series=showLLZone and ta.lowest(low, 2)[1] and ta.lowest(low, 2)[2] ? 1 : na, title="LL Zone", color=color.new(color.blue, 80), style=shape.triangledown, location=location.belowbar)
plotshape(series=showLHZone and ta.highest(high, 2)[1] and ta.lowest(low, 2)[2] ? 1 : na, title="LH Zone", color=color.new(color.orange, 80), style=shape.triangleup, location=location.abovebar)
plotshape(series=showHLZone and ta.lowest(low, 2)[1] and ta.highest(high, 2)[2] ? 1 : na, title="HL Zone", color=color.new(color.orange, 80), style=shape.triangledown, location=location.belowbar)