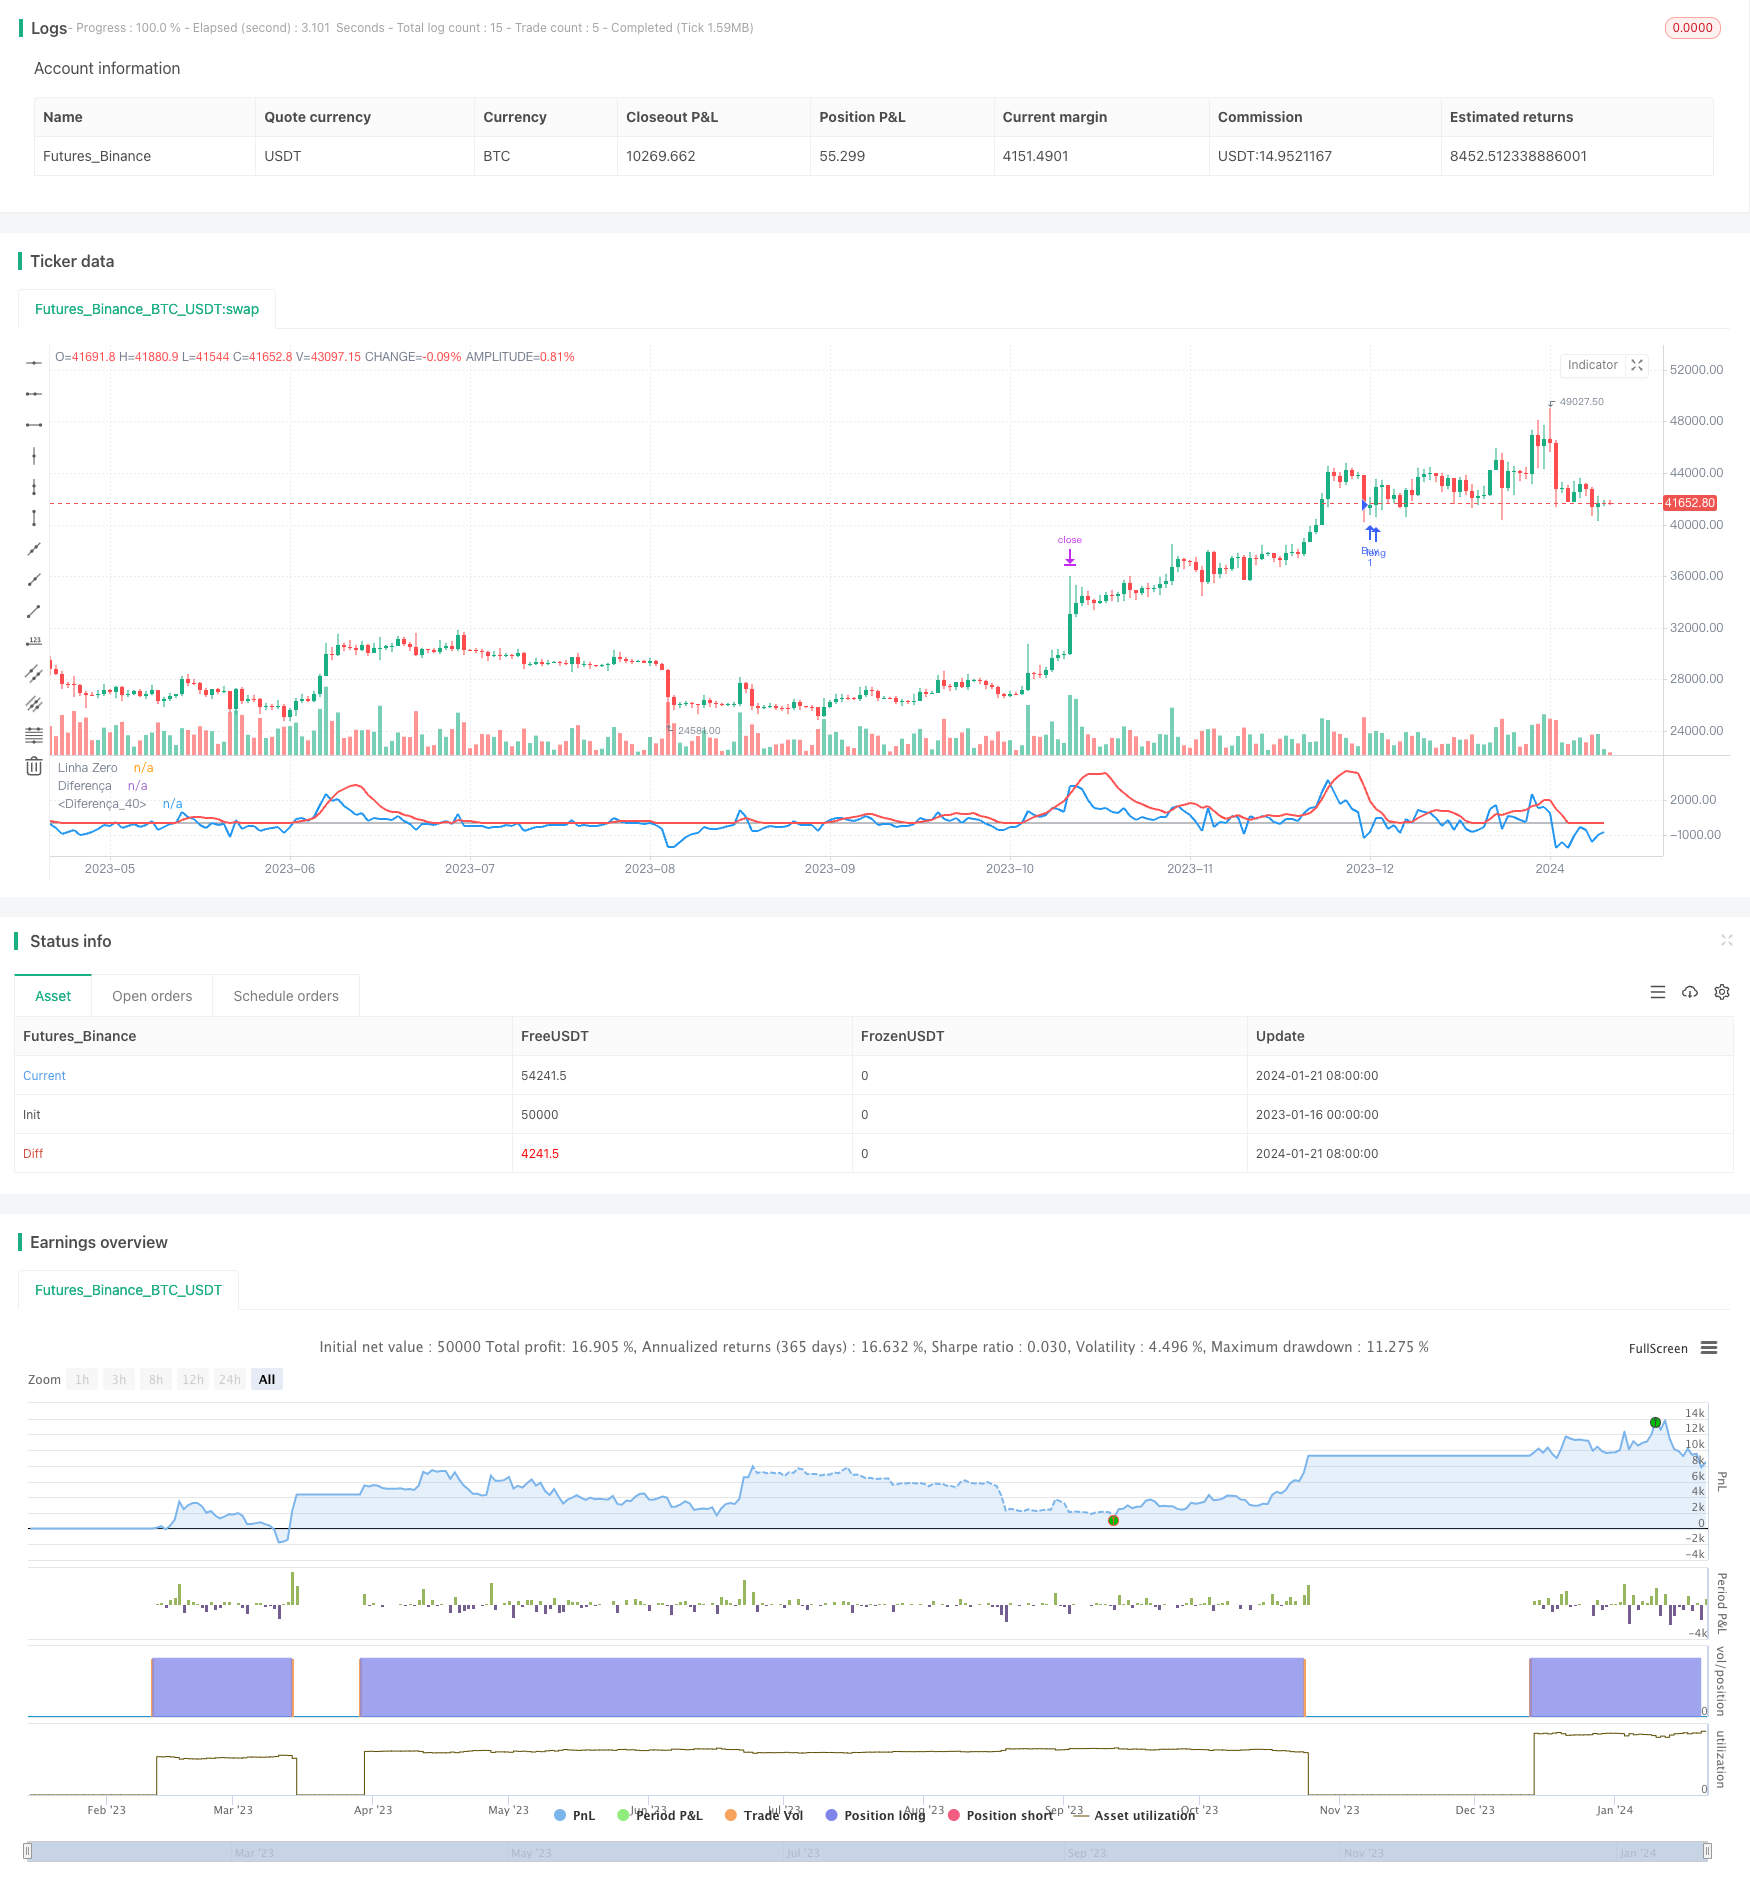
Overview
The Dual Moving Average Golden Cross algorithm generates trading signals by calculating the crossover between fast and slow moving average lines. The fast line uses an 8-day exponential moving average and the slow line uses an exponential moving average of the lowest prices over the last 8 days. When the fast line crosses above the slow line from below, a buy signal is generated. When the fast line crosses below the slow line from above, a sell signal is generated.
Strategy Logic
The core logic of this strategy is: the fast line represents recent price trend, while the slow line represents recent relatively low price levels. When the fast line crosses above the slow line, it indicates prices have started rising above recent lows, hence a buy signal is generated. When the fast line crosses below the slow line, it indicates prices have started falling below recent lows, hence a sell signal is generated.
Specifically, the strategy calculates an 8-day exponential moving average as the fast line, and an exponential moving average of the lowest prices over 8 days as the slow line. It then calculates the difference between the price and the fast line. When this difference starts turning positive, it indicates prices have started rising. When the difference starts turning negative, it indicates prices have started falling. A buy signal is generated when the difference crosses above 0. A sell signal is generated when the difference crosses below 0.
Advantage Analysis
The biggest advantage of the Dual Moving Average Golden Cross algorithm is its simple and clear logic that is easy to understand and implement. Using moving average crossovers to determine trading signals is a mature and commonly used technical analysis technique. This strategy applies this mature method and further improves it by using a combination of fast and slow lines to generate more reliable trading signals. This combination method has some positive effects in avoiding false signals and improving signal quality.
In addition, the strategy incorporates a stop loss mechanism. When prices rise more than 20%, stop loss will be set to 1.2 times the entry price for that position. This locks in most profits and avoids losses. It also ensures decent returns for the strategy.
Risk Analysis
The Dual Moving Average Golden Cross algorithm also carries some risks. The strategy solely relies on the relationship between prices and moving averages to determine trade entries and exits. If prices fluctuate abnormally while moving averages fail to reflect such moves in time, incorrect trading signals may be generated. Manual inspection of price moves is needed in such cases to avoid following the signals blindly and incurring losses.
Also, the 1.2 times entry price stop loss setting could be too conservative, unable to hold through entire trends. If uptrend continues, a triggered stop loss exit could exit prematurely and forfeit additional profits. Different parameters should be tested to find more appropriate stop loss positioning.
Enhancement Directions
There is room for further enhancements for this strategy. Firstly, different parameters can be tested to optimize the moving average period parameters for best signal quality. Secondly, volatility indicators could be incorporated to avoid generating false signals during price consolidation periods. Thirdly, machine learning methods could be applied to automatically optimize stop loss positioning. Fourthly, information from correlated assets could be utilized to establish portfolio trading systems for improving signal reliability.
Conclusion
Overall, the Dual Moving Average Golden Cross algorithm is a very practical quantitative trading strategy. It generates trading signals using the mature technical analysis technique of moving average crossovers, while improving parameters and rules. The strategy has simple and clear signals that are easy to comprehend. It filters out some noise for better signal quality and incorporates stop loss mechanisms to control risks. With further optimizations on parameters and models, it can become a robust automated trading system.
/*backtest
start: 2023-01-16 00:00:00
end: 2024-01-22 00:00:00
period: 1d
basePeriod: 1h
exchanges: [{"eid":"Futures_Binance","currency":"BTC_USDT"}]
*/

//@version=4
strategy(title = "Estratégia de Cruzamento das Linhas")

// Configuração da Média Móvel
emaPeriod = 8

ema= ema(close, emaPeriod)
ema1= ema(close[1], emaPeriod)
lowestEMA = lowest(ema, 8)

// Calcula a diferença entre o preço e a média móvel
diff = close - ema
diff1 = close[1] - ema1
diffLow = ema - lowestEMA

//Condições
diffZero = diff < 0
diffUnder = diff < diffLow
diffUm = diff > 0
Low0 = diffLow == 0


gain = strategy.position_avg_price*(1+0.2)
// Sinais de entrada
buy_signal = diffUnder and crossover(diff, diff1) and diffZero

sell_signal = diffUm and diffUnder and crossunder(diff, diff1)

// Executa as operações de compra/venda
if buy_signal
    strategy.entry("Buy", strategy.long)
if sell_signal
    strategy.exit("Buy", limit = gain)

// Plota as linhas
plot(0, title="Linha Zero", color=color.gray)
plot(diff, title="Diferença", color=color.blue, linewidth=2)

plot(diffLow, title="Diferença", color=color.red, linewidth=2)