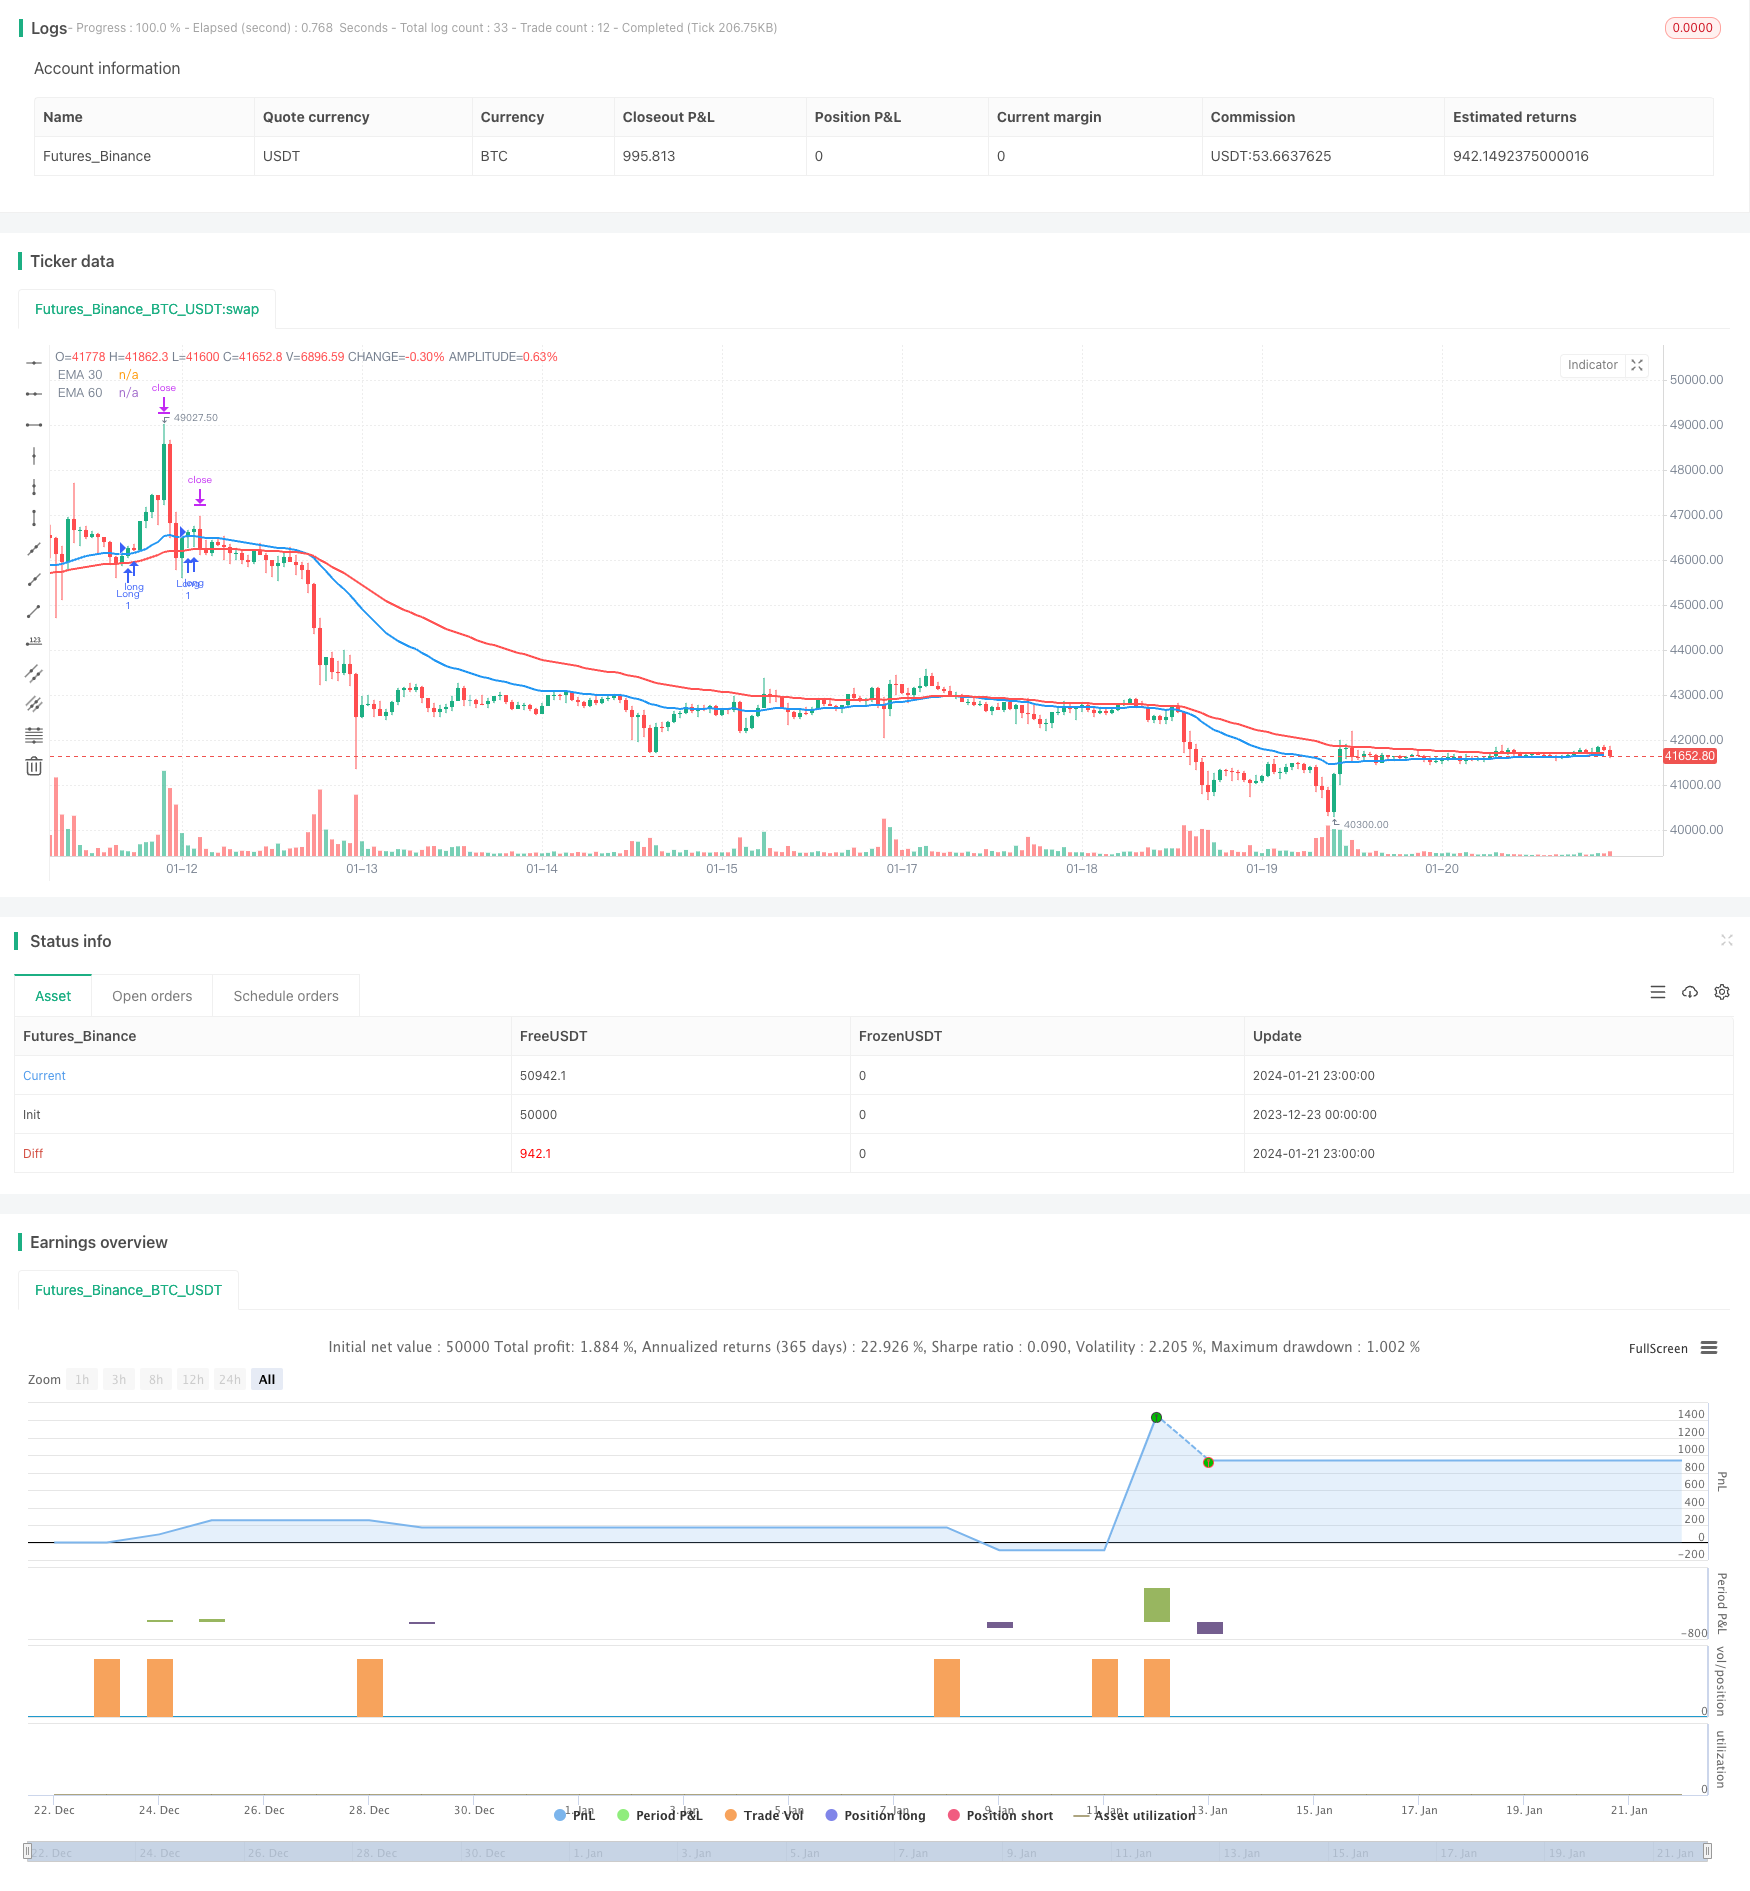
Overview
This strategy is a trend trading strategy based on the dual EMA cross using EMA indicators with different lengths. It determines the current trend in consolidation by judging the position relationship of the EMA lines. And it generates buy signals by judging the cross situation between price and EMA lines during breakouts. It also sets take profit and stop loss points to lock in profits and control risks.
Strategy Principle
The strategy uses 30-period and 60-period EMA lines. EMA lines are smoothed moving average lines which put more weight on recent prices, so EMA lines can respond to price changes faster.
When the shorter-period EMA line crosses over the longer-period EMA line, a buy signal is generated. This indicates an upward trend currently. When price breaks through the shorter EMA from bottom up, with support from the long-term trend, price will continue going up. So we buy at this point.
This strategy also sets take profit and stop loss points. Take profit point is set to the highest point among the highest prices of last 10 bars, to lock in maximum profits. Stop loss point is set to the long EMA line to control risks.
Advantage Analysis
The main advantages of this strategy include:
- Using EMA lines to determine trend reliability is reliable and it’s easy to catch trend opportunities.
- Dual EMA cross signals have high sensitivity.
- Take profit and stop loss points can lock in profits and control risks.
Risk Analysis
The main risks of this strategy include:
- EMA lines may have lagging response when trend reverses, which may lead to losses.
- Dual EMA cross signals may produce wrong signals sometimes.
- Improper take profit and stop loss point settings may lead to premature stop of profit taking and cutting losses.
Corresponding solutions:
- Optimize EMA parameters for faster response to trend reversal.
- Add filters to avoid wrong signals.
- Test and determine optimal take profit and stop loss parameters.
Optimization Directions
The main optimization directions for this strategy include:
- Optimize EMA parameters to find best parameter combinations.
- Add other indicators as auxiliary judgements, like MACD, KDJ etc.
- Add volume indicators to avoid false breakouts without enough trading volumes.
- Use machine learning methods to dynamically optimize take profit and stop loss points.
- Test robustness of parameters on different products to find best fitting.
Conclusion
Overall this strategy is a typical trend trading strategy based on EMA lines to determine trend direction and dual EMA cross for signal triggering. It utilizes EMA lines to judge major trends and dual cross signals to improve accuracy. Lagging response of EMA lines to trend reversal and wrong signals of dual cross are its main risks. By parameter optimization and auxiliary system expansion, the stability and scalability of this strategy can be improved. In general, this strategy has some practical utility.
/*backtest
start: 2023-12-23 00:00:00
end: 2024-01-22 00:00:00
period: 1h
basePeriod: 15m
exchanges: [{"eid":"Futures_Binance","currency":"BTC_USDT"}]
*/

//@version=5
strategy("EMA Cross Strategy", overlay=true)

// 输入设置
ema30_length = input.int(30, title="EMA 30 Length", minval=1)
ema60_length = input.int(60, title="EMA 60 Length", minval=1)

// 计算EMA
ema30 = ta.ema(close, ema30_length)
ema60 = ta.ema(close, ema60_length)

// 绘制EMA
plot(ema30, title="EMA 30", color=color.blue, linewidth=2)
plot(ema60, title="EMA 60", color=color.red, linewidth=2)

// 判断上升趋势
uptrend = close > ema30 and ema30 > ema60

// 买入条件
buy_signal = ta.crossover(close, ema30) and close[1] < ema30[1] and close[1] > ema60[1] and uptrend

// 止盈止损
take_profit_level = ta.highest(high, 10)
stop_loss_level = ema60

// 执行交易
if (buy_signal)
    strategy.entry("Long", strategy.long)
    strategy.exit("Exit", "Long", stop=stop_loss_level, limit=take_profit_level)