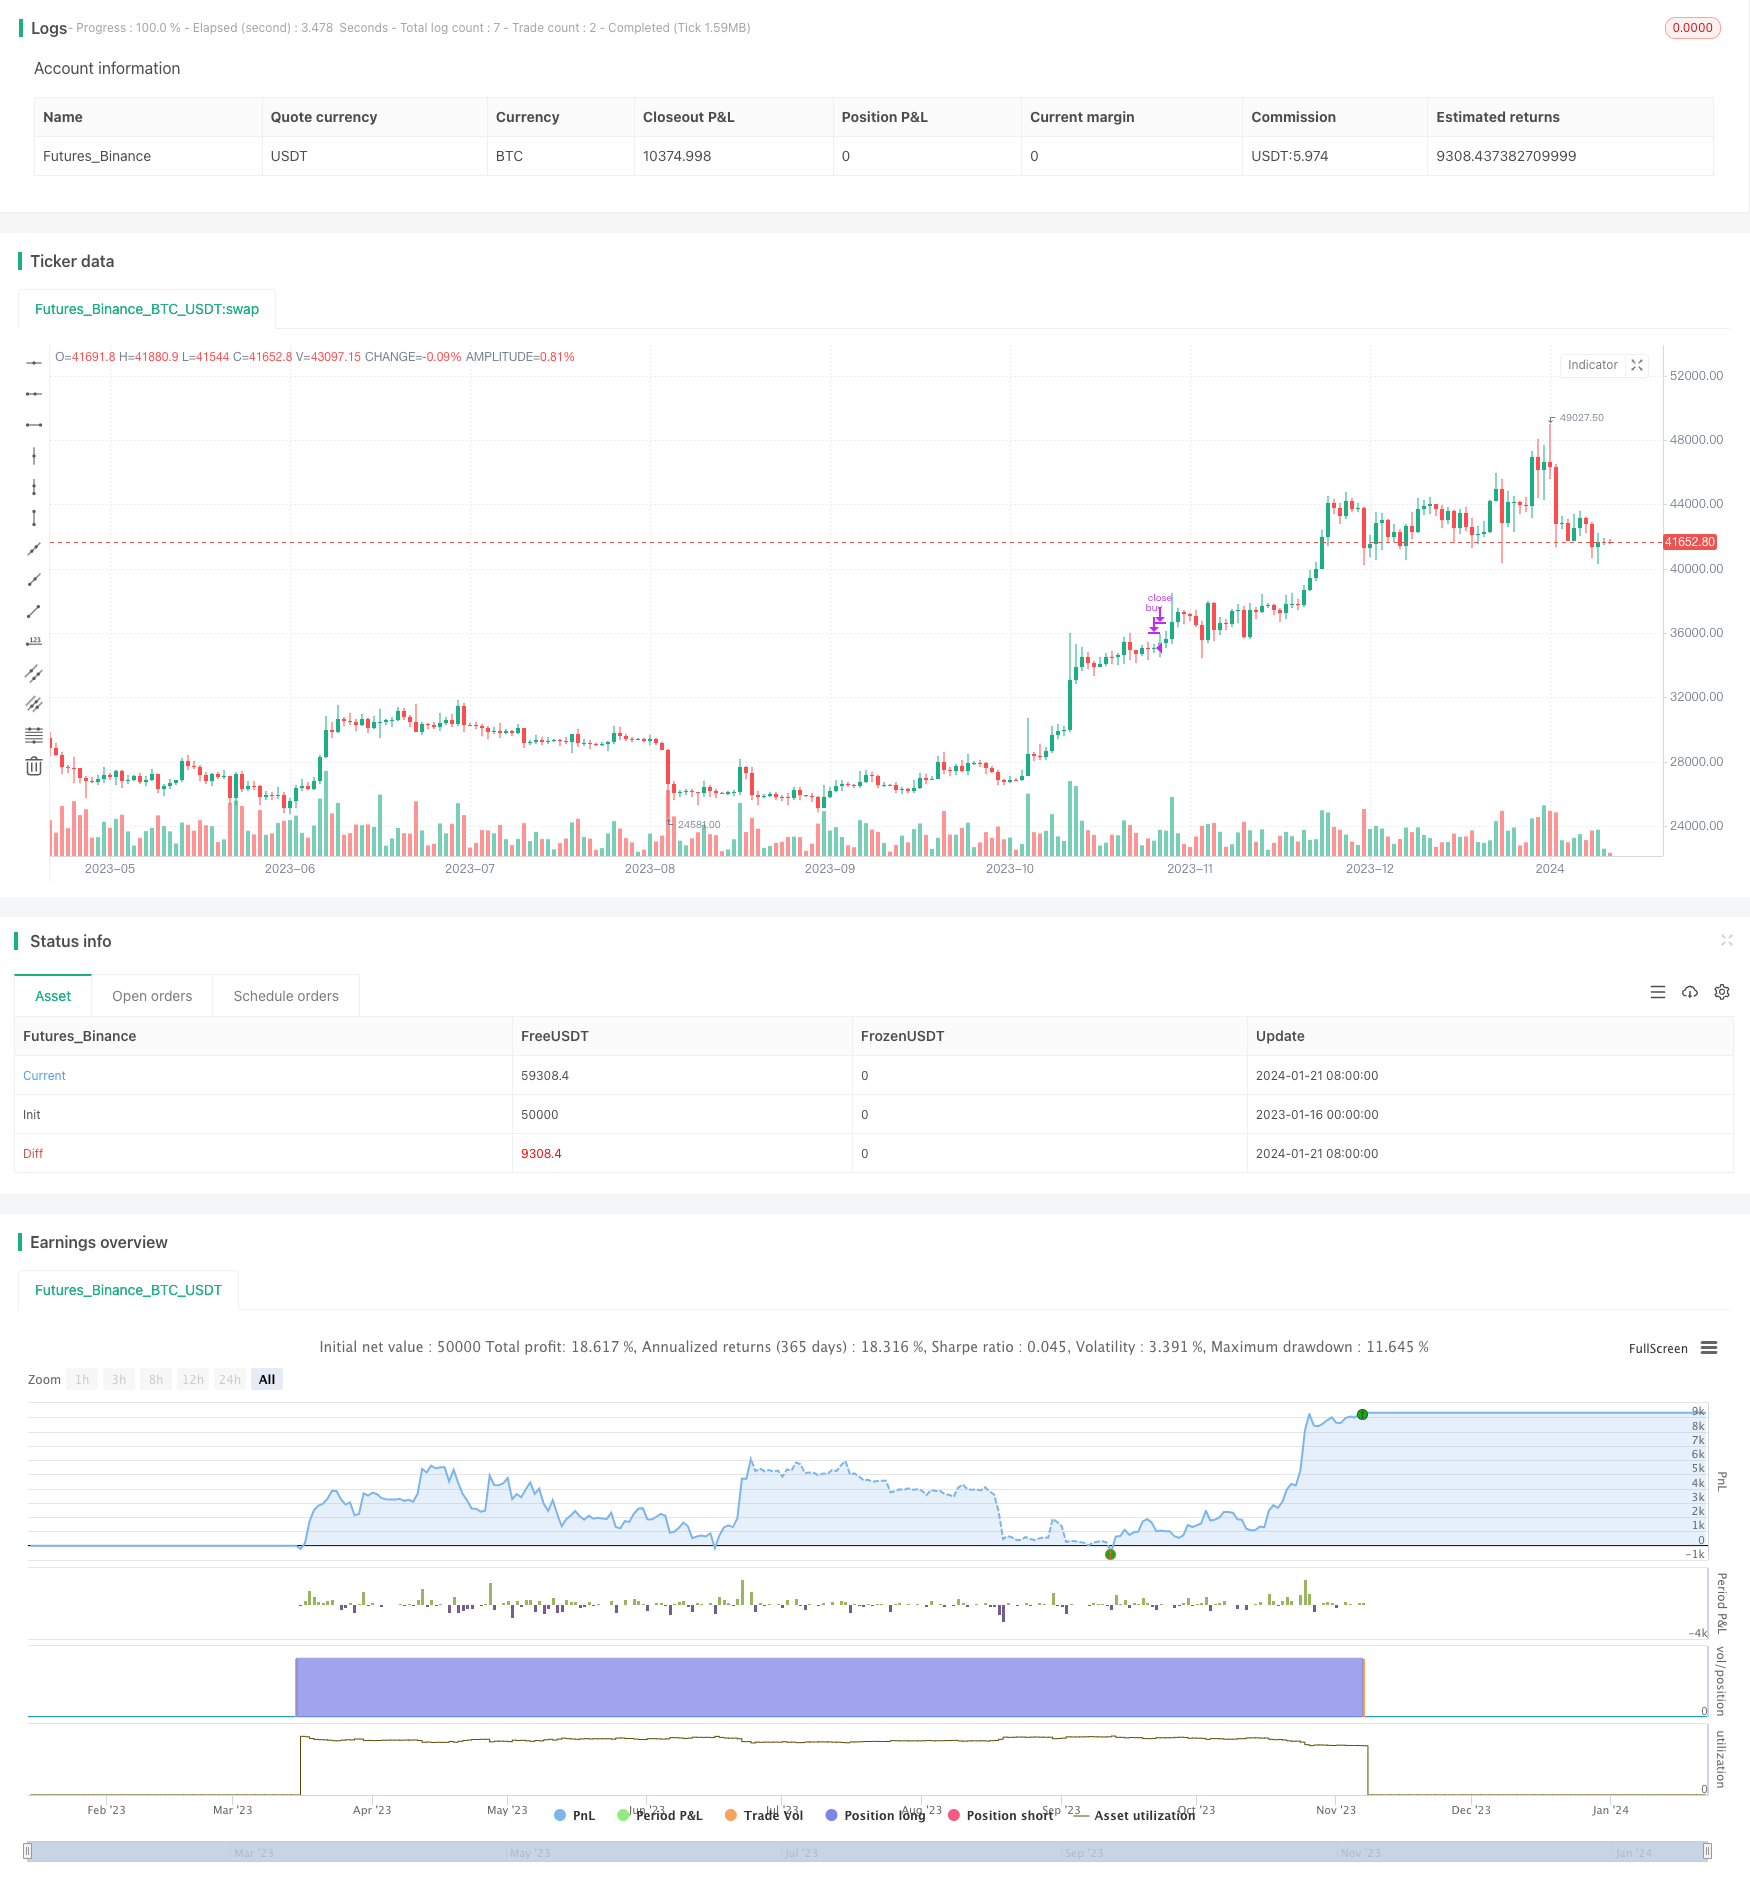
Overview
This strategy generates trading signals by calculating the crossover of the MACD and RSI indicators. It produces buy and sell signals when the RSI is overbought or oversold and MACD crossover occurs. The strategy combines the advantages of two different types of indicators, considering both the trend of prices and overbought/oversold situations, thereby improving the effectiveness of the strategy.
Strategy Principle
The strategy mainly uses the combination of MACD and RSI indicators to generate trading signals. MACD is generally used to determine price trends and momentum changes, while RSI is used to determine overbought/oversold conditions.
The strategy first calculates the fast line, slow line and signal line of the MACD. When the fast line is greater than the slow line, a golden cross signal is generated. When the fast line is less than the slow line, a death cross signal is generated. This indicates that the price trend and momentum are changing.
At the same time, the strategy calculates the RSI indicator and sets overbought and oversold lines. When the RSI is lower than the oversold line, it indicates overselling. When the RSI is higher than the overbought line, it indicates overbuying.
When RSI overbought/oversold occurs, the strategy generates buy signals when MACD golden cross happens, and generates sell signals when MACD death cross happens. That is when the price trend reverses, the MACD indicator is used to capture turning points due to its sensitivity. The RSI indicator avoids wrong trades when no overbought/oversold occurs.
Advantage Analysis
The strategy combines the advantages of MACD and RSI indicators to improve its effectiveness:
MACD can sensitively capture price changes, while RSI considers overbought/oversold situations, complementing each other.
Combining the two indicators can filter out some noisy trading signals and reduce unnecessary trades.
MACD measures the difference between moving averages, while RSI measures the proportion of price changes, the two methods can verify each other.
MACD responds quickly to price changes, while RSI overbought/oversold divergences are obvious, good combo effect.
Risks and Solutions
There are also certain risks in this strategy:
Both MACD and RSI are vulnerable to sudden events, which may generate wrong signals. Parameters can be adjusted to filter out signals.
The effect on individual stocks may not be ideal, indices or portfolios can be considered.
Satisfying both MACD crossover and RSI overbought/oversold may miss some opportunities. RSI parameter requirements could be reduced.
Optimization Directions
The strategy can also be optimized in the following aspects:
Optimize MACD and RSI parameters to suit different trading varieties.
Add stop loss strategy to stop loss in time when losses reach a certain percentage.
Combine with other indicators such as Bollinger Bands and KDJ to set more strict trading signal conditions.
Run the strategy at high frequency data to utilize the fast/slow properties of MACD and improve strategy performance.
According to backtest results, adjust overbought/oversold lines of RSI to find the best parameter combinations.
Summary
The MACD and RSI crossover strategy combines trend following and overbought/oversold judgment, which can effectively capture price reversal points and enhance strategy performance. But there are still some limitations, requiring continuous testing and optimization according to market conditions for the strategy to achieve maximum performance.
/*backtest
start: 2023-01-16 00:00:00
end: 2024-01-22 00:00:00
period: 1d
basePeriod: 1h
exchanges: [{"eid":"Futures_Binance","currency":"BTC_USDT"}]
*/

//@version=5
// © sabirt
strategy(title='MACD and RSI', overlay=true, shorttitle='MACD&RSI')
//MACD Settings
fastMA = input.int(title='Fast moving average', defval=12, minval=1)
slowMA = input.int(title='Slow moving average', defval=26, minval=1)
signalLength = input.int(9, minval=1)

//RSI settings
RSIOverSold = input.int(35, minval=1)
RSIOverBought = input.int(80, minval=1)
src = close
len = input.int(14, minval=1, title='Length')
up = ta.rma(math.max(ta.change(src), 0), len)
down = ta.rma(-math.min(ta.change(src), 0), len)
rsi = down == 0 ? 100 : up == 0 ? 0 : 100 - 100 / (1 + up / down)
wasOversold = rsi[0] <= RSIOverSold or rsi[1] <= RSIOverSold or rsi[2] <= RSIOverSold or rsi[3] <= RSIOverSold or rsi[4] <= RSIOverSold or rsi[5] <= RSIOverSold
wasOverbought = rsi[0] >= RSIOverBought or rsi[1] >= RSIOverBought or rsi[2] >= RSIOverBought or rsi[3] >= RSIOverBought or rsi[4] >= RSIOverBought or rsi[5] >= RSIOverBought


[currMacd, _, _] = ta.macd(close[0], fastMA, slowMA, signalLength)
[prevMacd, _, _] = ta.macd(close[1], fastMA, slowMA, signalLength)
signal = ta.ema(currMacd, signalLength)

avg_1 = math.avg(currMacd, signal)
crossoverBear = ta.cross(currMacd, signal) and currMacd < signal ? avg_1 : na
avg_2 = math.avg(currMacd, signal)
crossoverBull = ta.cross(currMacd, signal) and currMacd > signal ? avg_2 : na

strategy.entry('buy', strategy.long, when=crossoverBull and wasOversold)
strategy.close('buy', when=crossoverBear and wasOverbought)