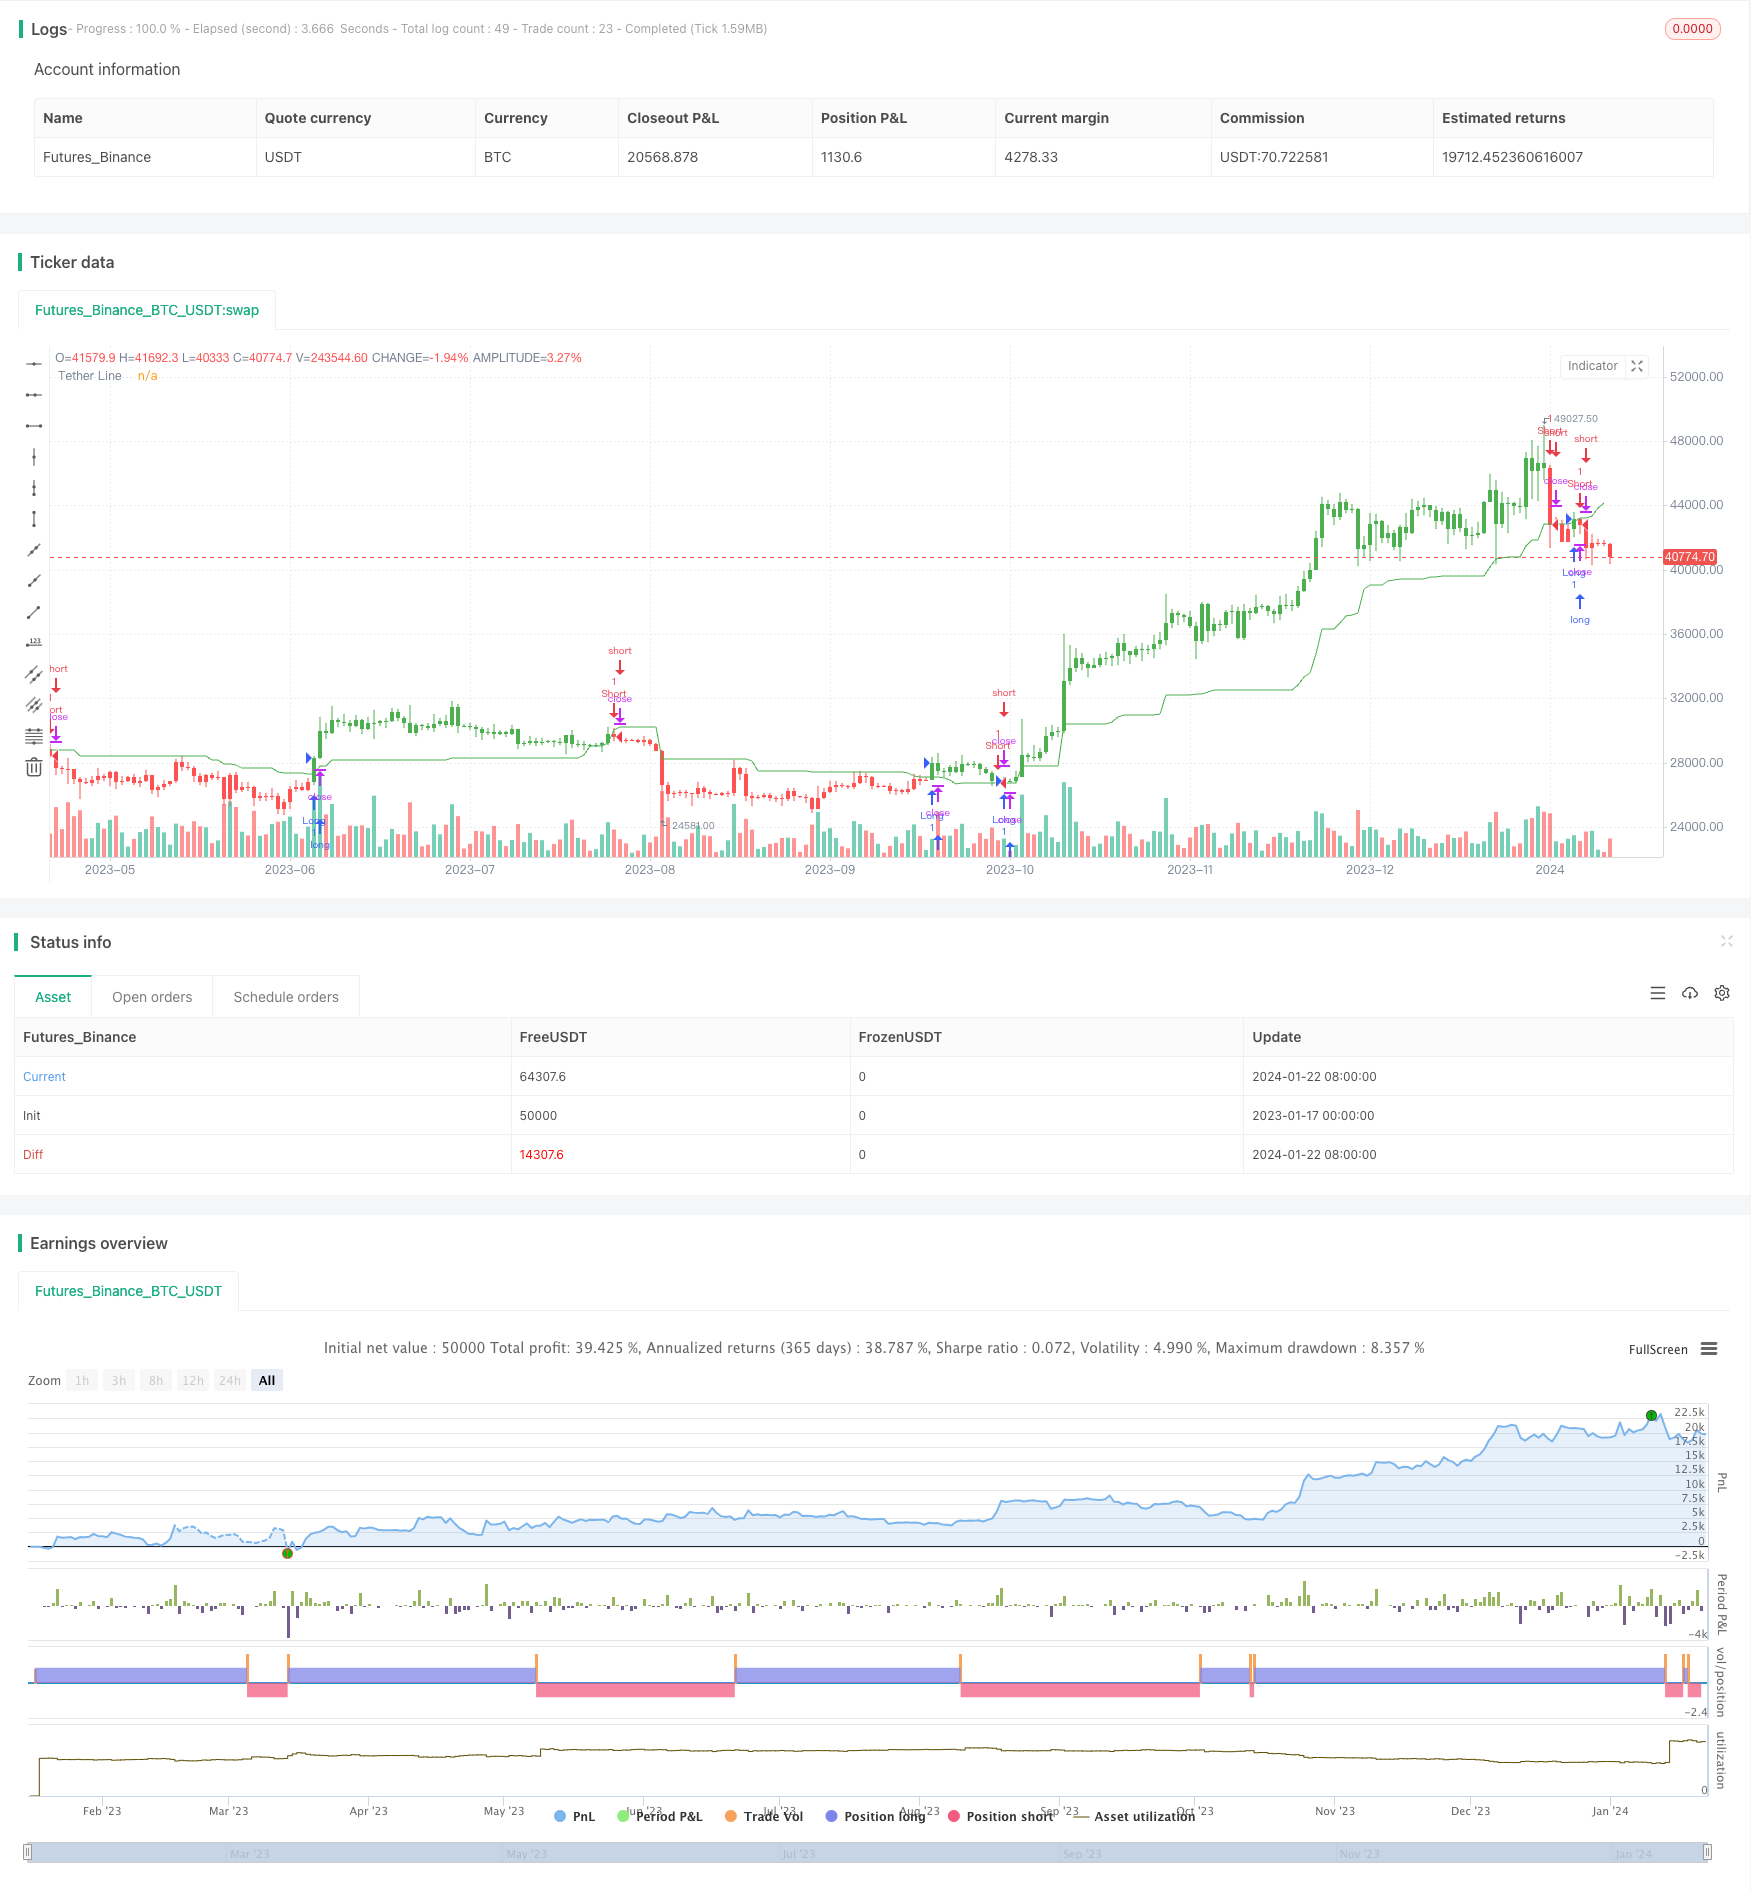
Overview
The adaptive moving average tracking strategy is a trend following strategy based on moving averages. It utilizes the characteristic that stock prices fluctuate around the moving average line and generates a moving average line by calculating the averages of highest and lowest prices over different periods as trading signals when prices break above or below the line. It is suitable for medium-to-long term trend trading.
Strategy Logic
The core indicator of the adaptive moving average tracking strategy is the moving average line xTether based on the input parameter Length. This line is the average of the highest price upper and the lowest price lower over the past Length periods. It generates a short signal when the price is below the line and a long signal when the price is above the line. The strategy determines whether to hold a long or a short position based on the relationship between the price and the moving average line. It also has the feature to switch between long and short direction.
Specifically, the strategy is implemented through the following steps:
Input the parameter Length, default to 50 days, used to calculate the Lookback period for the moving average line;
Calculate the highest price upper and lowest price lower over the past Length periods;
Compute the average of the highest and lowest prices to get the moving average line xTether;
Compare the closing price close with xTether to determine long and short signals;
Switch between long and short direction based on the reverse input parameter;
Take long or short positions based on signals and change bar colors.
Advantages
The strategy has the following advantages:
Adopt adaptive moving average to effectively track market trends;
The Length period parameter adapts to different trading horizons;
Switchable long/short direction adapts to market changes;
Changing bar colors after taking positions forms visual effect for easy identification.
Risks
There are also some risks with this strategy:
Fails to timely stop loss when trend reverses;
Improper Length parameter setting can affect strategy performance;
Potential overfitting risk from excessive trading.
To mitigate these risks, stop loss, Length parameter tuning, and trading frequency limiting should be utilized.
Enhancement Areas
The strategy can be enhanced from the following aspects:
Add stop loss mechanism to reduce losses during trend reversal;
Optimize the Length parameter to find the best setting;
Add filtering conditions to avoid unnecessary trading and overfitting risk;
Incorporate other indicators to improve decision accuracy.
Conclusion
In general, the adaptive moving average tracking strategy is a feasible trend following system. It tracks price trends using moving averages, adapts to different periods with the Length parameter, and switches between long and short. The main advantage is strong tracking capability making it suitable for medium-to-long term trading, but risks like being trapped and bad parameter tuning exist. Further improvements on loss control, parameter optimization and trading frequency reduction can enhance the strategy’s performance.
/*backtest
start: 2023-01-17 00:00:00
end: 2024-01-23 00:00:00
period: 1d
basePeriod: 1h
exchanges: [{"eid":"Futures_Binance","currency":"BTC_USDT"}]
*/

//@version=2
////////////////////////////////////////////////////////////
//  Copyright by HPotter v1.0 06/12/2017
// Tether line indicator is the first component of TFS trading strategy.
// It was named this way because stock prices have a tendency to cluster
// around it. It means that stock prices tend to move away from the midpoint
// between their 50-day highs and lows, then return to that midpoint at some
// time in the future. On a chart, it appears as though the stock price is
// tethered to this line, and hence the name.
//
// You can change long to short in the Input Settings
// WARNING:
// - For purpose educate only
// - This script to change bars colors.
////////////////////////////////////////////////////////////
strategy(title="TFS: Tether Line", shorttitle="Tether Line", overlay = true )
Length = input(50, minval=1)
reverse = input(false, title="Trade reverse")
lower = lowest(Length)
upper = highest(Length)
xTether = avg(upper, lower)
pos = iff(xTether > close, -1,
       iff(xTether < close, 1, nz(pos[1], 0)))
possig = iff(reverse and pos == 1, -1,
          iff(reverse and pos == -1, 1, pos))
if (possig == 1)
    strategy.entry("Long", strategy.long)
if (possig == -1)
    strategy.entry("Short", strategy.short)
barcolor(possig == -1 ? red: possig == 1 ? green : blue )
plot(xTether, color=green, title="Tether Line")