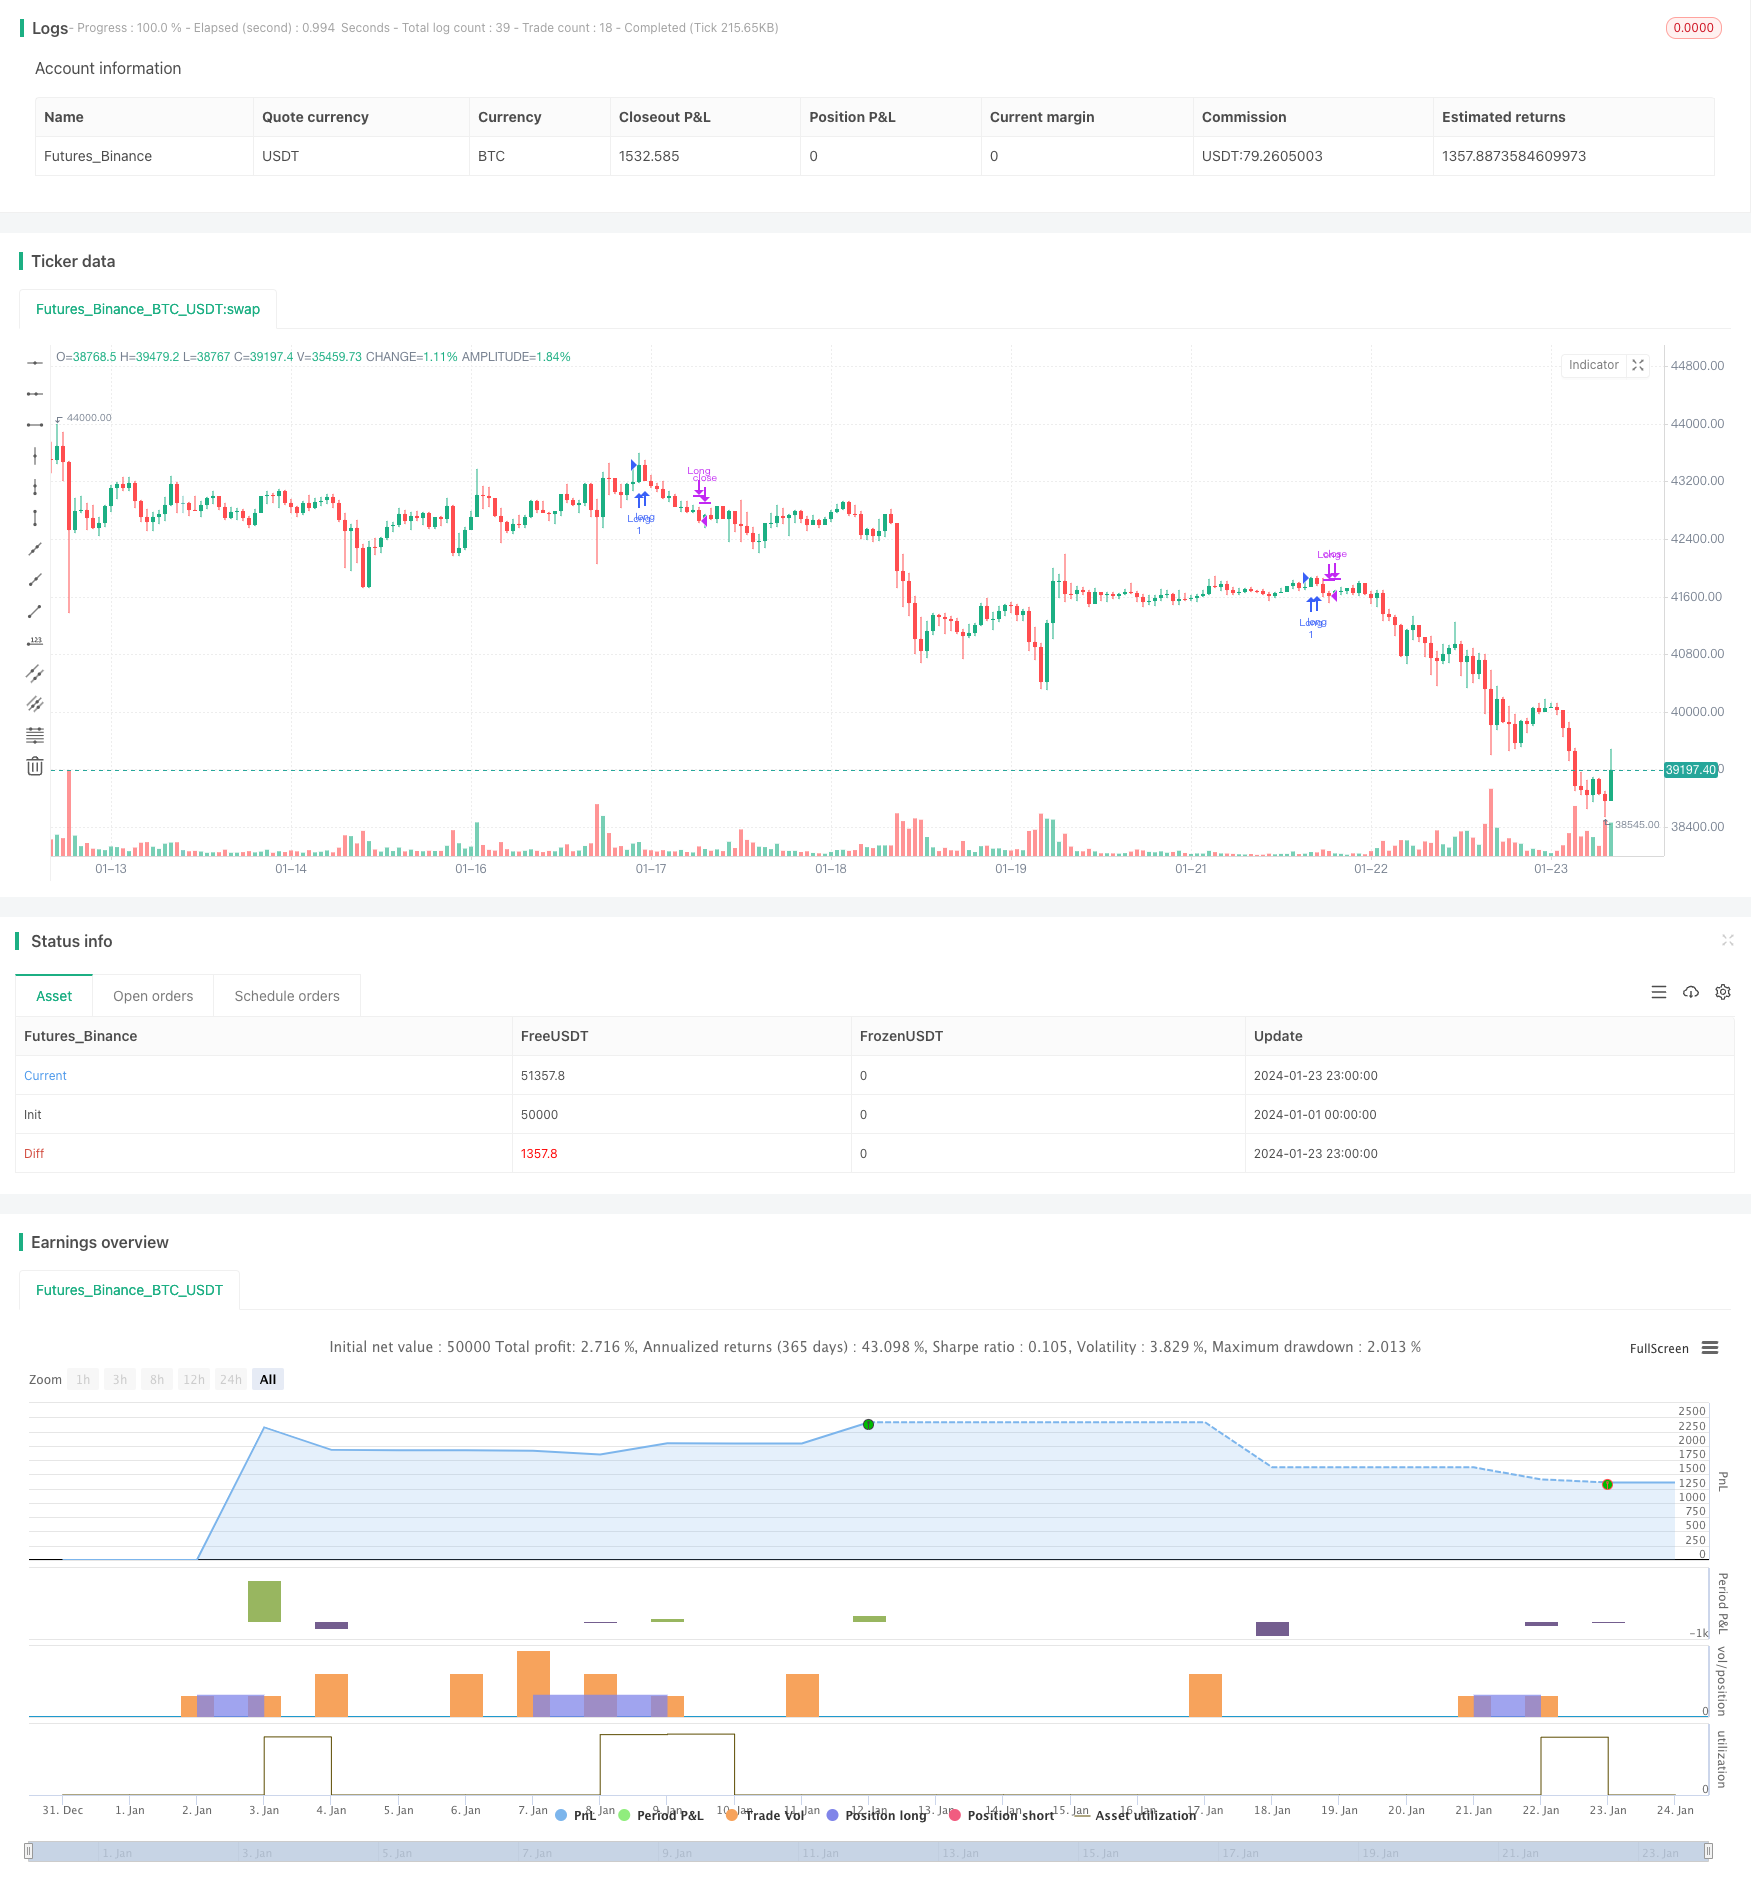
Overview
This strategy combines the trend-following metrics VFI and Moving Averages with the reversal indicator Bollinger Bands to adaptively catch trends and reversals in the market.
Strategy Logic
The main components of this strategy are:
VFI indicator to determine the trend. It uses the logarithmic rate of change of typical price and trading volume to reasonably match price and volume.
EMA difference indicator to determine trend. It calculates the percentage difference between 20-day EMA and 50-day EMA to judge the mid-long term trend direction.
Bollinger Bands to detect reversals. The middle band is 20-day SMA, and the width of the bands is 1.5 standard deviation of the middle band. Trading signals are generated when price breaks the upper or lower band.
VFI amplitude to detect exhaustion. When VFI is approaching its limits (0, 20), the probability of trend reversal is considered to be higher.
When price breaks above the upper Bollinger Band and VFI and EMA difference indicates upward trend, go long. When price breaks below the lower band or VFI reaches a threshold, close position.
Advantages
The introduction of VFI makes the price-volume relationship more reasonable and avoids blindly following prices.
The combination of EMA difference and VFI makes trend determination more reliable.
The combination of Bollinger Bands and VFI makes the strategy more adaptable to the two-way fluctuations in the market.
Risks
Volume-price indicators cannot completely avoid the risk of false breakouts.
EMA difference has some lag and cannot react timely to short-term turns.
Improper parameters of Bollinger Bands may lead to overtrading or capturing the market.
Solutions:
Combine more indicators to determine the trend to avoid relying on a single one.
Adjust EMA parameters to proper values.
Test the impacts of Bollinger parameters on the strategy in different market conditions.
Optimization Directions
Continue optimizing VFI parameters to make it more sensitive.
Add breakout judgment based on price channels or Envelopes indicator.
Test the introduction of more volume-price indicators like OBV, PVT etc.
Introduce machine learning and AI techniques to realize dynamic parameter optimization.
Conclusion
This strategy comprehensively considers trend following and reversal detection with VFI, EMA difference and Bollinger Bands to catch two-way market fluctuations. The next step is to continue optimizing parameters, enrich judgment metrics, expand applicability, and improve profitability.
/*backtest
start: 2024-01-01 00:00:00
end: 2024-01-24 00:00:00
period: 1h
basePeriod: 15m
exchanges: [{"eid":"Futures_Binance","currency":"BTC_USDT"}]
*/

// This source code is subject to the terms of the Mozilla Public License 2.0 at https://mozilla.org/MPL/2.0/
// © beststockalert

//@version=4

strategy(title="Super Bollinger Band Breakout", shorttitle = "Super BB-BO", overlay=true)
source = close

length = input(130, title="VFI length")
coef = input(0.2)
vcoef = input(2.5, title="Max. vol. cutoff")
signalLength=input(5)


// session


pre = input( type=input.session, defval="0400-0935")
trade_session = input( type=input.session, defval="0945-1700")
use_trade_session = true
isinsession = use_trade_session ? not na(time('1', trade_session)) : true


is_newbar(sess) =>
    t = time("D", sess)
    not na(t) and (na(t[1]) or t > t[1])


is_session(sess) =>
    not na(time(timeframe.period, sess))

preNew = is_newbar(pre)
preSession = is_session(pre)

float preLow = na
preLow := preSession ? preNew ? low : min(preLow[1], low) : preLow[1]

float preHigh = na
preHigh := preSession ? preNew ? high : max(preHigh[1], high) : preHigh[1]


//   vfi 9lazybear
ma(x,y) => 0 ? sma(x,y) : x

typical=hlc3
inter = log( typical ) - log( typical[1] )
vinter = stdev(inter, 30 )
cutoff = coef * vinter * close
vave = sma( volume, length )[1]
vmax = vave * vcoef
vc = iff(volume < vmax, volume, vmax) //min( volume, vmax )
mf = typical - typical[1]
vcp = iff( mf > cutoff, vc, iff ( mf < -cutoff, -vc, 0 ) )

vfi = ma(sum( vcp , length )/vave, 3)
vfima=ema( vfi, signalLength )


//ema diff


ema20 = ema(close,20)
ema50 = ema(close,50)


diff = (ema20-ema50)*100/ema20
ediff = ema(diff,20)

//
basis = sma(source, 20)
dev = 1.5 * stdev(source, 20)

upper = basis + dev
lower = basis - dev


ema9 = ema(source, 9)

if ( ((crossover(source, upper) and diff>ediff and diff>0) or (close>upper and (vfi >0 or vfima>0 or ediff>0.05) and (vfi<14 or vfima<14)) ))
    strategy.entry("Long", strategy.long)


if (crossunder(source, lower) or vfi>19 or vfima>19 or diff<(ediff+0.01) )
    strategy.close("Long")