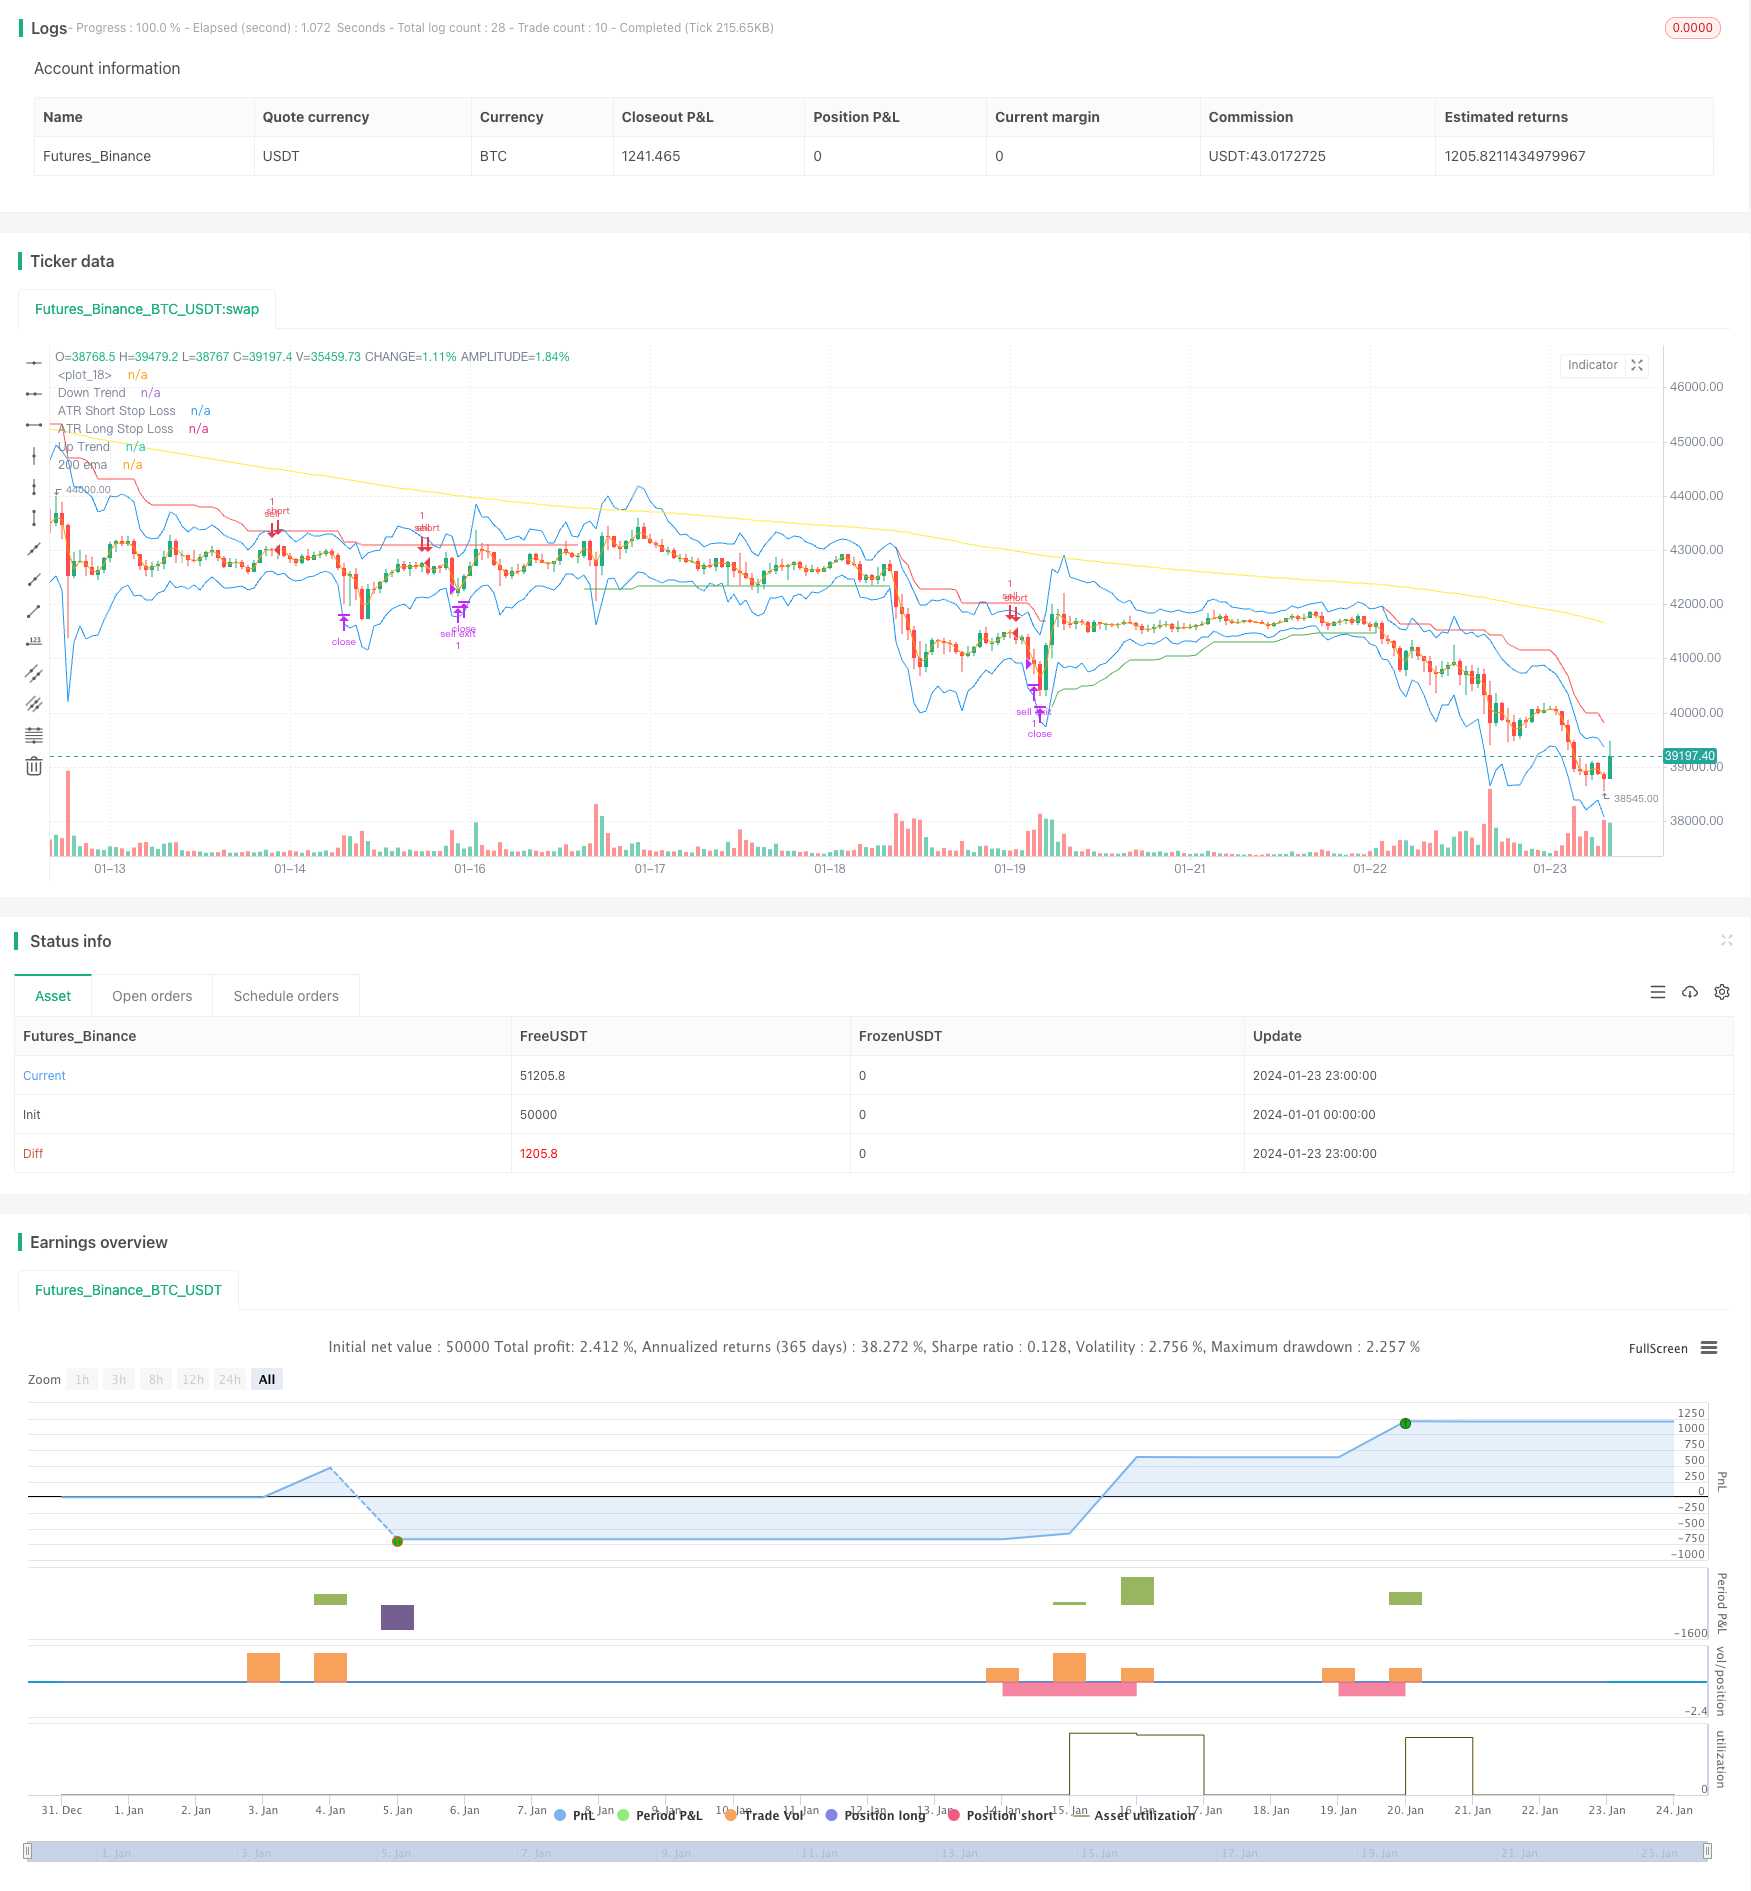
Overview
This is a tracking stop loss trading strategy that combines multiple technical indicators. It mainly uses indicators like Supertrend, Stochastic, 200-day Moving Average and ATR stop loss to identify trading signals and set stop loss levels. This strategy is suitable for medium-to-long term trend trading and can effectively control risks.
Strategy Logic
Go long when the Stochastic K line falls from the overbought zone, the Supertrend indicates an upward trend, and the price breaks through the 200-day moving average; Go short when the Stochastic K line rises from the oversold zone, the Supertrend indicates a downward trend, and the price falls below the 200-day moving average. Use the ATR indicator to dynamically set the stop loss after entering the position.
Specifically, when the Stochastic K value crosses above 80, it is considered an overbought signal; when the Stochastic K value crosses below 20, it is considered an oversold signal. The Supertrend indicator determines the price trend direction. When Supertrend points up, it means the price is in an upward trend. When Supertrend points down, it means the price is in a downward trend. The ATR indicator is used to calculate the true volatility.
Long signal entry conditions: Stochastic K line falls from overbought territory (below 80), Supertrend points up, price above 200-day MA.
Short signal entry conditions: Stochastic K line rises from oversold territory (above 20), Supertrend points down, price below 200-day MA.
After entering the position, set the ATR stop loss to track price fluctuations to control risks. The long stop loss is the lowest price minus the ATR value multiplied by a coefficient; the short stop loss is the highest price plus the ATR value multiplied by a coefficient.
Advantages
This strategy combines multiple indicators to determine the trend direction and entry timing, which can effectively filter false signals. At the same time, by adopting dynamic ATR tracking stop loss, it can control risks according to market fluctuations to maximize capital preservation.
Compared with simple moving average and other trend tracking strategies, this strategy can better capture turning points. Compared with a single stop loss method, this dynamic ATR stop loss can be more flexible. Therefore, this strategy overall has a good risk-reward ratio.
Risks
This strategy relies mainly on technical indicators, if the indicators give wrong signals, it may lead to losses due to reverse operations. Also in sideways markets, stop loss may be frequently triggered, resulting losses.
In addition, although the ATR stop loss can adjust the stop level based on volatility, it cannot completely avoid the probability of stop loss being penetrated. If there is a price gap, the stop loss order may be triggered directly.
Optimization
This strategy can be optimized in the following aspects:
Adjust indicator parameters to improve the accuracy of trading signals, e.g. test different parameter Stochastic indicators, or adjust the ATR period and multiplier parameters of the Supertrend indicator.
Test the effect of other stop loss methods, such as more flexible adaptive intelligent stop loss algorithms, or consider trailing stop loss.
Increase filters and only take high-conviction signals, e.g. add indicators like trading volume, to avoid wrong entry when volume is insufficient.
Optimize money management strategies such as dynamically adjusting position size.
Conclusion
The Stochastic Supertrend tracking stop loss trading strategy combines multiple indicators to determine trend direction and adopts intelligent ATR tracking to control risks. This strategy can effectively filter noise and has good risk-reward ratio. We can continuously optimize this strategy by adjusting parameters, modifying stop loss methods and adding filters to adapt to more complex market environments.
/*backtest
start: 2024-01-01 00:00:00
end: 2024-01-24 00:00:00
period: 1h
basePeriod: 15m
exchanges: [{"eid":"Futures_Binance","currency":"BTC_USDT"}]
*/

// This source code is subject to the terms of the Mozilla Public License 2.0 at https://mozilla.org/MPL/2.0/
// © araamas

//@version=5
strategy("stoch supertrd atr 200ma", overlay=true, process_orders_on_close=true)
var B = 0
if strategy.position_size > 0 //to figure out how many bars away did buy order happen
    B += 1

if strategy.position_size == 0
    B := 0

atrPeriod = input(10, "ATR Length")
factor = input.float(3.0, "Factor", step = 0.01)

[supertrend, direction] = ta.supertrend(factor, atrPeriod)

bodyMiddle = plot((open + close) / 2, display=display.none)
upTrend = plot(direction < 0 ? supertrend : na, "Up Trend", color = color.green, style=plot.style_linebr)
downTrend = plot(direction < 0? na : supertrend, "Down Trend", color = color.red, style=plot.style_linebr)

ema = ta.ema(close, 200)
plot(ema, title="200 ema", color=color.yellow)

b = input.int(defval=14, title="length k%")
d = input.int(defval=3, title="smoothing k%")
s = input.int(defval=3, title="smoothing d%")
smooth_k = ta.sma(ta.stoch(close, high, low, b), d)
smooth_d = ta.sma(smooth_k, s)

////////////////////////////////////////////////////////////////////////////////
length = input.int(title="Length", defval=12, minval=1)
smoothing = input.string(title="Smoothing", defval="SMA", options=["RMA", "SMA", "EMA", "WMA"])
m = input(1.5, "Multiplier")
src1 = input(high)
src2 = input(low)
pline = input(true, "Show Price Lines")
col1 = input(color.blue, "ATR Text Color")
col2 = input(color.teal, "Low Text Color",inline ="1")
col3 = input(color.red, "High Text Color",inline ="2")

collong = input(color.teal, "Low Line Color",inline ="1")
colshort = input(color.red, "High Line Color",inline ="2")

ma_function(source, length) =>
	if smoothing == "RMA"
		ta.rma(source, length)
	else
		if smoothing == "SMA"
			ta.sma(source, length)
		else
			if smoothing == "EMA"
				ta.ema(source, length)
			else
				ta.wma(source, length)

a = ma_function(ta.tr(true), length) * m
x = ma_function(ta.tr(true), length) * m + src1
x2 = src2 - ma_function(ta.tr(true), length) * m

p1 = plot(x, title = "ATR Short Stop Loss", color=color.blue)
p2 = plot(x2, title = "ATR Long Stop Loss", color= color.blue)


///////////////////////////////////////////////////////////////////////////////////////////////

shortCondition = high < ema and direction == 1 and smooth_k > 80
if (shortCondition) and strategy.position_size == 0
    strategy.entry("sell", strategy.short)

longCondition = low > ema and direction == -1 and smooth_k < 20
if (longCondition) and strategy.position_size == 0
    strategy.entry("buy", strategy.long)

g = (strategy.opentrades.entry_price(0)-x2) * 2
k = (x - strategy.opentrades.entry_price(0)) * 2

if strategy.position_size > 0
    strategy.exit(id="buy exit", from_entry="buy",limit=strategy.opentrades.entry_price(0) + g, stop=x2)

if strategy.position_size < 0
    strategy.exit(id="sell exit", from_entry="sell",limit=strategy.opentrades.entry_price(0) - k, stop=x)

//plot(strategy.opentrades.entry_price(0) - k, color=color.yellow)
//plot(strategy.opentrades.entry_price(0) + g, color=color.red)