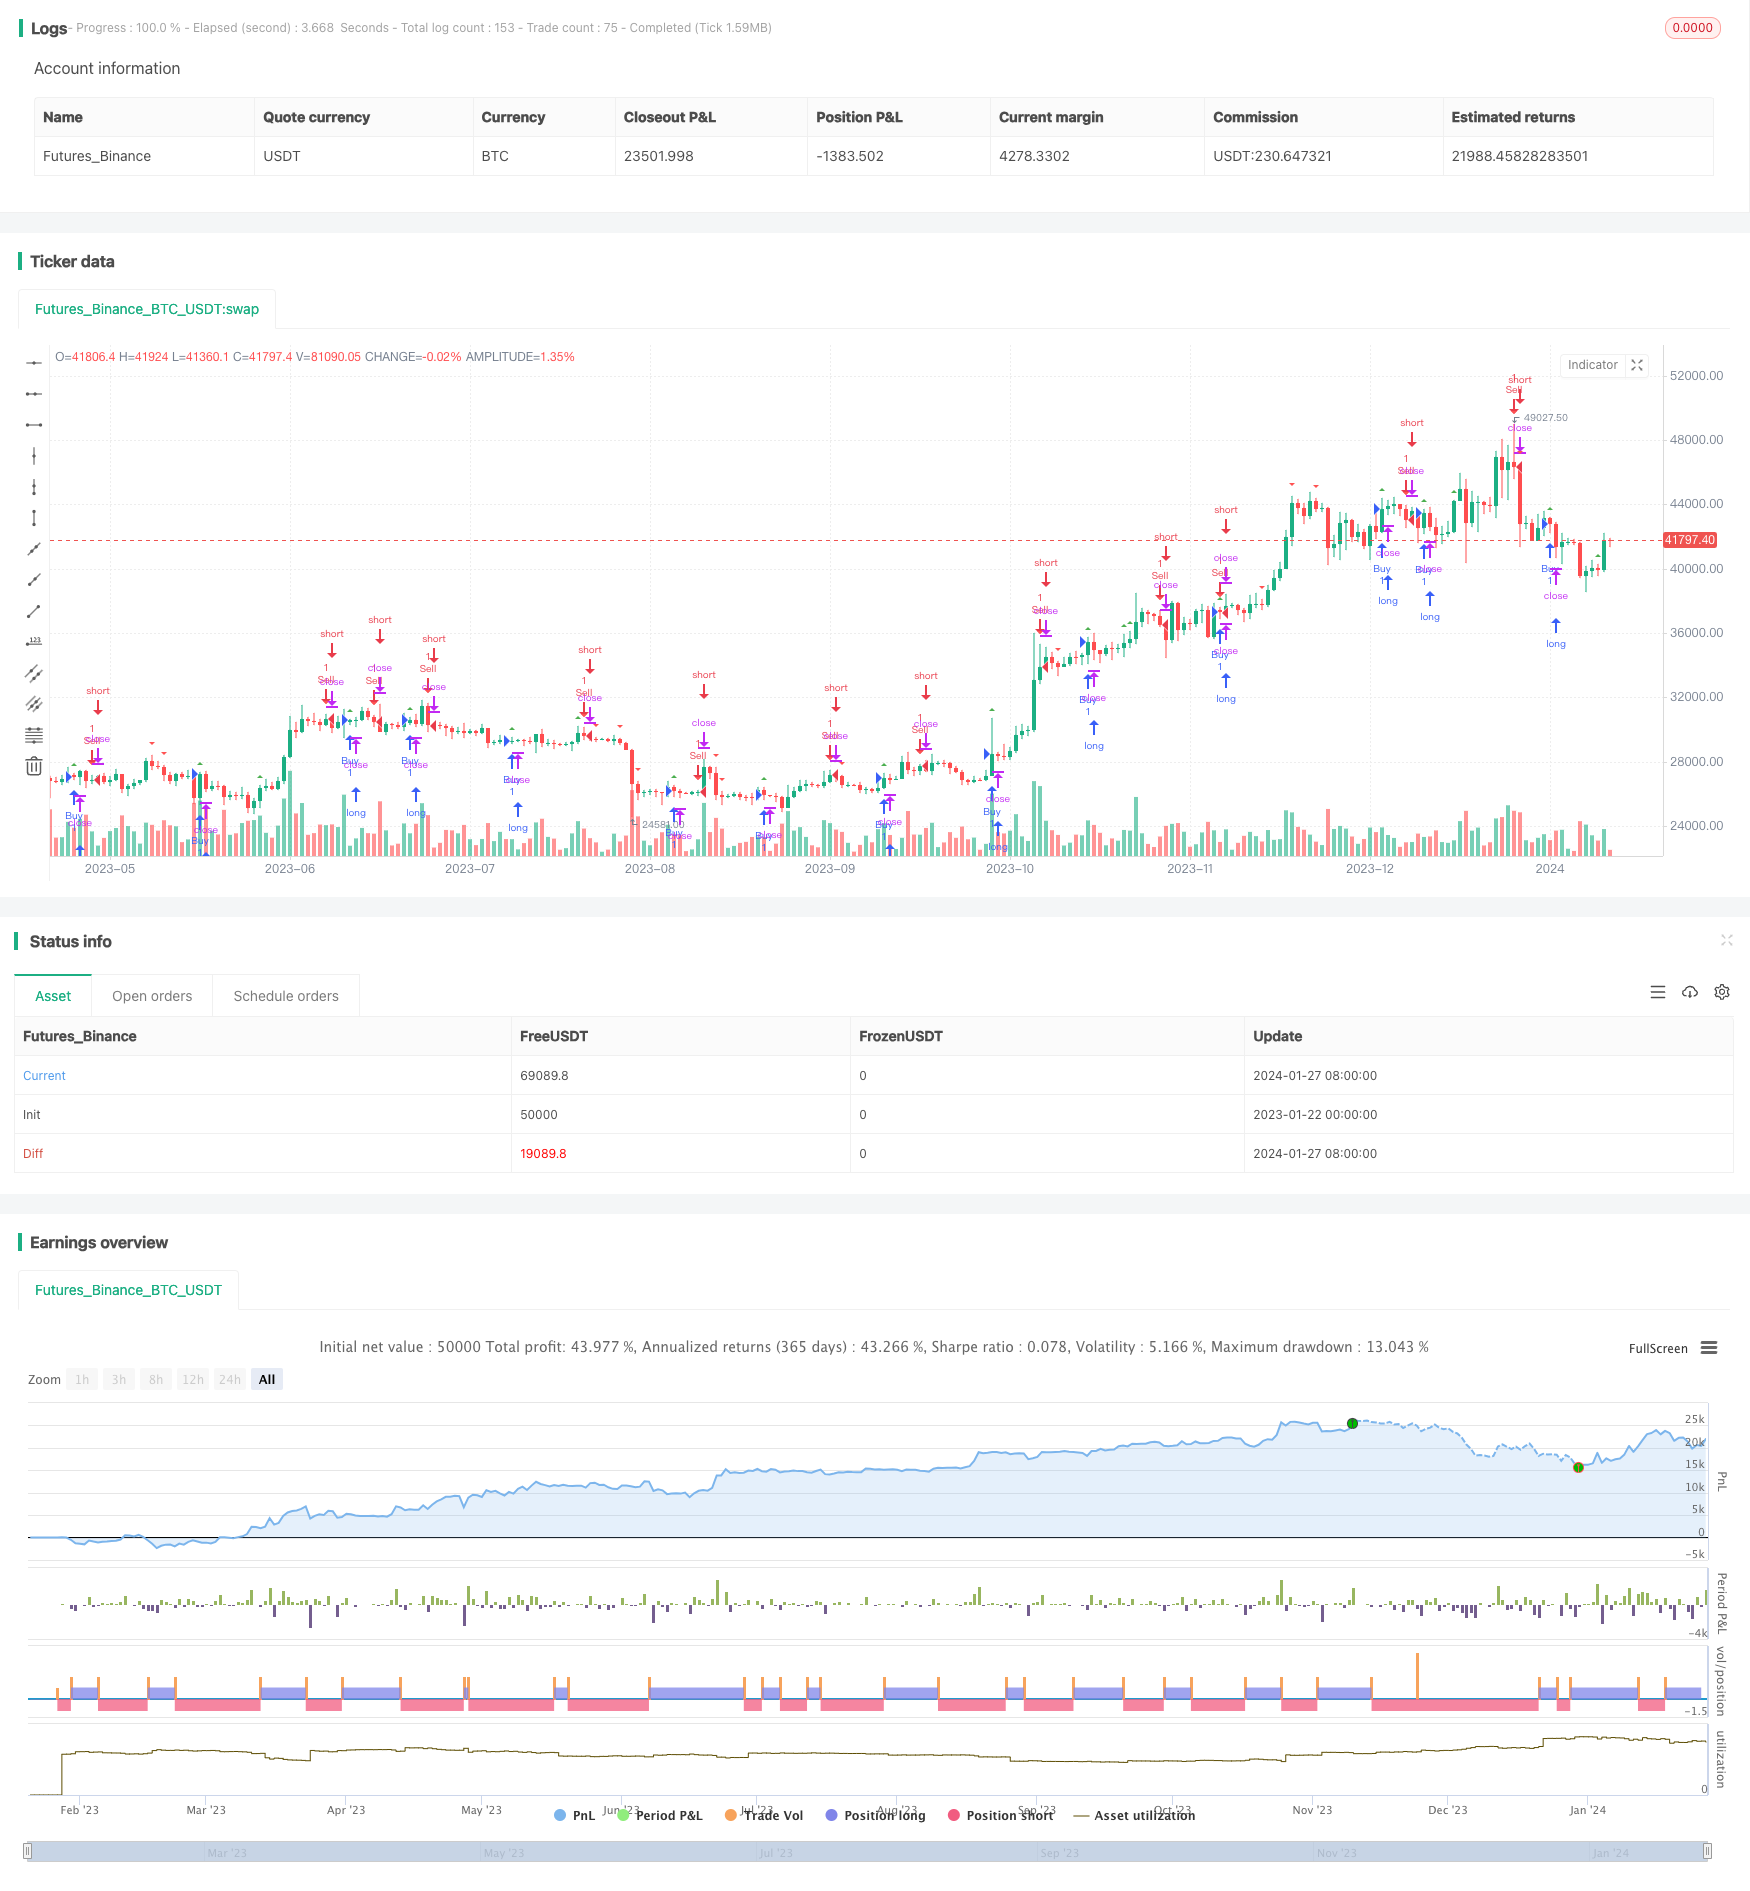
Overview
This strategy combines the Stochastic RSI and MFI indicators to identify overbought and oversold conditions and make buy and sell decisions. The basic idea is to consider selling when stock prices are overbought and consider buying when stock prices are oversold.
Strategy Principle
The Stochastic RSI indicator combines the advantages of the Stochastic Oscillator (KDJ) and the Relative Strength Index (RSI). It first calculates RSI values over a period of time through RSI, and then applies the Stochastic method to calculate the Stochastics K and D values of this RSI array to determine whether the RSI is overbought or oversold.
The Money Flow Index (MFI) indicator judges the market supply-demand relationship and overbought/oversold conditions based on changes in volume and price. The indicator believes that rising prices reflect the bullish forces being stronger than the bearish forces. When volatility increases, the bullish forces are stronger than the bearish forces, so increasing turnover heralds the bulls driving up prices.
This strategy sets overbought and oversold levels for Stochastic RSI and MFI. When the K line of the Stochastic RSI indicator crosses oversold line upward or the MFI indicator crosses oversold line upward, a buy signal is generated. When the K line of the Stochastic RSI indicator crosses overbought line downward or the MFI indicator crosses overbought line downward, a sell signal is generated.
Advantages of the Strategy
This strategy of combining Stochastic RSI and MFI indicators can more reliably identify overbought/oversold conditions in the market and avoid generating wrong signals.
Firstly, the Stochastic RSI indicator itself has higher reliability and sensitivity, and can judge overbought/oversold conditions more accurately than the ordinary Stochastic Oscillator.
Secondly, the MFI indicator judges overbought/oversold conditions from the perspective of changes in volume and price, providing a reference from another dimension to avoid errors caused by judging from a single perspective.
Finally, Stochastic RSI and MFI indicators are complementary. Stochastic RSI focuses more on price changes itself to determine market conditions, while MFI focuses more on changes in volume and turnover. Using the two in combination allows judging market conditions from a more comprehensive perspective and making more accurate and reliable trading decisions.
Risks of the Strategy
The main risks of this strategy include:
The risk of indicators generating wrong signals. Although Stochastic RSI and MFI indicators both have high reliability, they may still generate wrong buy/sell signals in certain market environments, resulting in trading losses.
The risk of improper parameter settings for overbought/oversold indicators. The parameter settings of Stochastic RSI and MFI indicators have a great influence on trading signals. If the parameters are set improperly, it will weaken the utility of the indicators.
The risk of lagging signals from indicators. Stochastic RSI and MFI indicators more or less have some lag, which may miss the best buy/sell timing.
The risk of consolidation during vacant periods. If the market consolidates sideways during the vacant periods when indicators have not issued any signals, it will lead to some opportunity cost.
The solutions to corresponding risks include: adjusting indicator parameters, setting stop loss, reducing position size, incorporating other indicators, etc.
Optimization Directions of the Strategy
The strategy can be optimized in the following aspects:
Incorporate momentum indicators. Add judgment conditions based on momentum indicator signals on top of the Stochastic RSI and MFI indicator signals to avoid trading during consolidation periods. For example, adding breakout criteria for close price/volume.
Add stop loss mechanism. For long-term holdings, add moving stop loss. For short-term trading, set stop loss points to control single loss.
Optimize parameter settings. Adjust parameters of Stochastic RSI and MFI like length, position of overbought/oversold lines etc, so that parameter settings fit better with market conditions.
Dynamically adjust strategies according to market conditions. Identify trending and consolidating markets, run trend-following strategies during trending markets and disable strategies during consolidating markets to avoid unnecessary trading.
Incorporate machine learning algorithms to automatically optimize. Apply reinforcement learning algorithms to dynamically adjust parameters and rules based on backtest results to achieve automatic optimization of strategies.
/*backtest
start: 2023-01-22 00:00:00
end: 2024-01-28 00:00:00
period: 1d
basePeriod: 1h
exchanges: [{"eid":"Futures_Binance","currency":"BTC_USDT"}]
*/

// This source code is subject to the terms of the Mozilla Public License 2.0 at https://mozilla.org/MPL/2.0/
// © carterac

//@version=5
strategy("MFI and Stoch RSI Bot", overlay=true)

// Stochastic RSI settings
length = input(14, title="Stochastic RSI Length")
smoothK = input(3, title="Stochastic RSI K")
smoothD = input(3, title="Stochastic RSI D")

// Stochastic RSI overbought and oversold levels
stochRSIOverbought = input(70, title="Stochastic RSI Overbought Level")
stochRSIOversold = input(20, title="Stochastic RSI Oversold Level")

// Money Flow Index (MFI) settings
mfiLength = input(14, title="MFI Length")
mfiOverbought = input(70, title="MFI Overbought Level")
mfiOversold = input(20, title="MFI Oversold Level")

// Calculate RSI
rsiValue = ta.rsi(close, 11)

// Calculate Stochastic RSI
rsiHigh = ta.highest(rsiValue, 11)
rsiLow = ta.lowest(rsiValue, 7)
k = ta.sma(100 * (rsiValue - rsiLow) / (rsiHigh - rsiLow), 3)
d = ta.sma(k, 3)

// Calculate MFI
mfiValue = ta.mfi(volume, mfiLength)

// Determine buy and sell signals
buyCondition = ta.crossover(k, stochRSIOversold) or ta.crossover(mfiValue, mfiOversold)
sellCondition = ta.crossunder(k, stochRSIOverbought) or ta.crossunder(mfiValue, mfiOverbought)

// Plotting signals
plotshape(buyCondition, location.belowbar, color=color.green, style=shape.triangleup, title="Buy Signal")
plotshape(sellCondition, location.abovebar, color=color.red, style=shape.triangledown, title="Sell Signal")

strategy.entry("Buy", strategy.long, when = buyCondition)
strategy.entry("Sell", strategy.short, when = sellCondition)