Dynamic Stop-Loss Moving Average Strategy
Author: ChaoZhang, Date: 2024-01-29 15:52:43Tags:

Overview
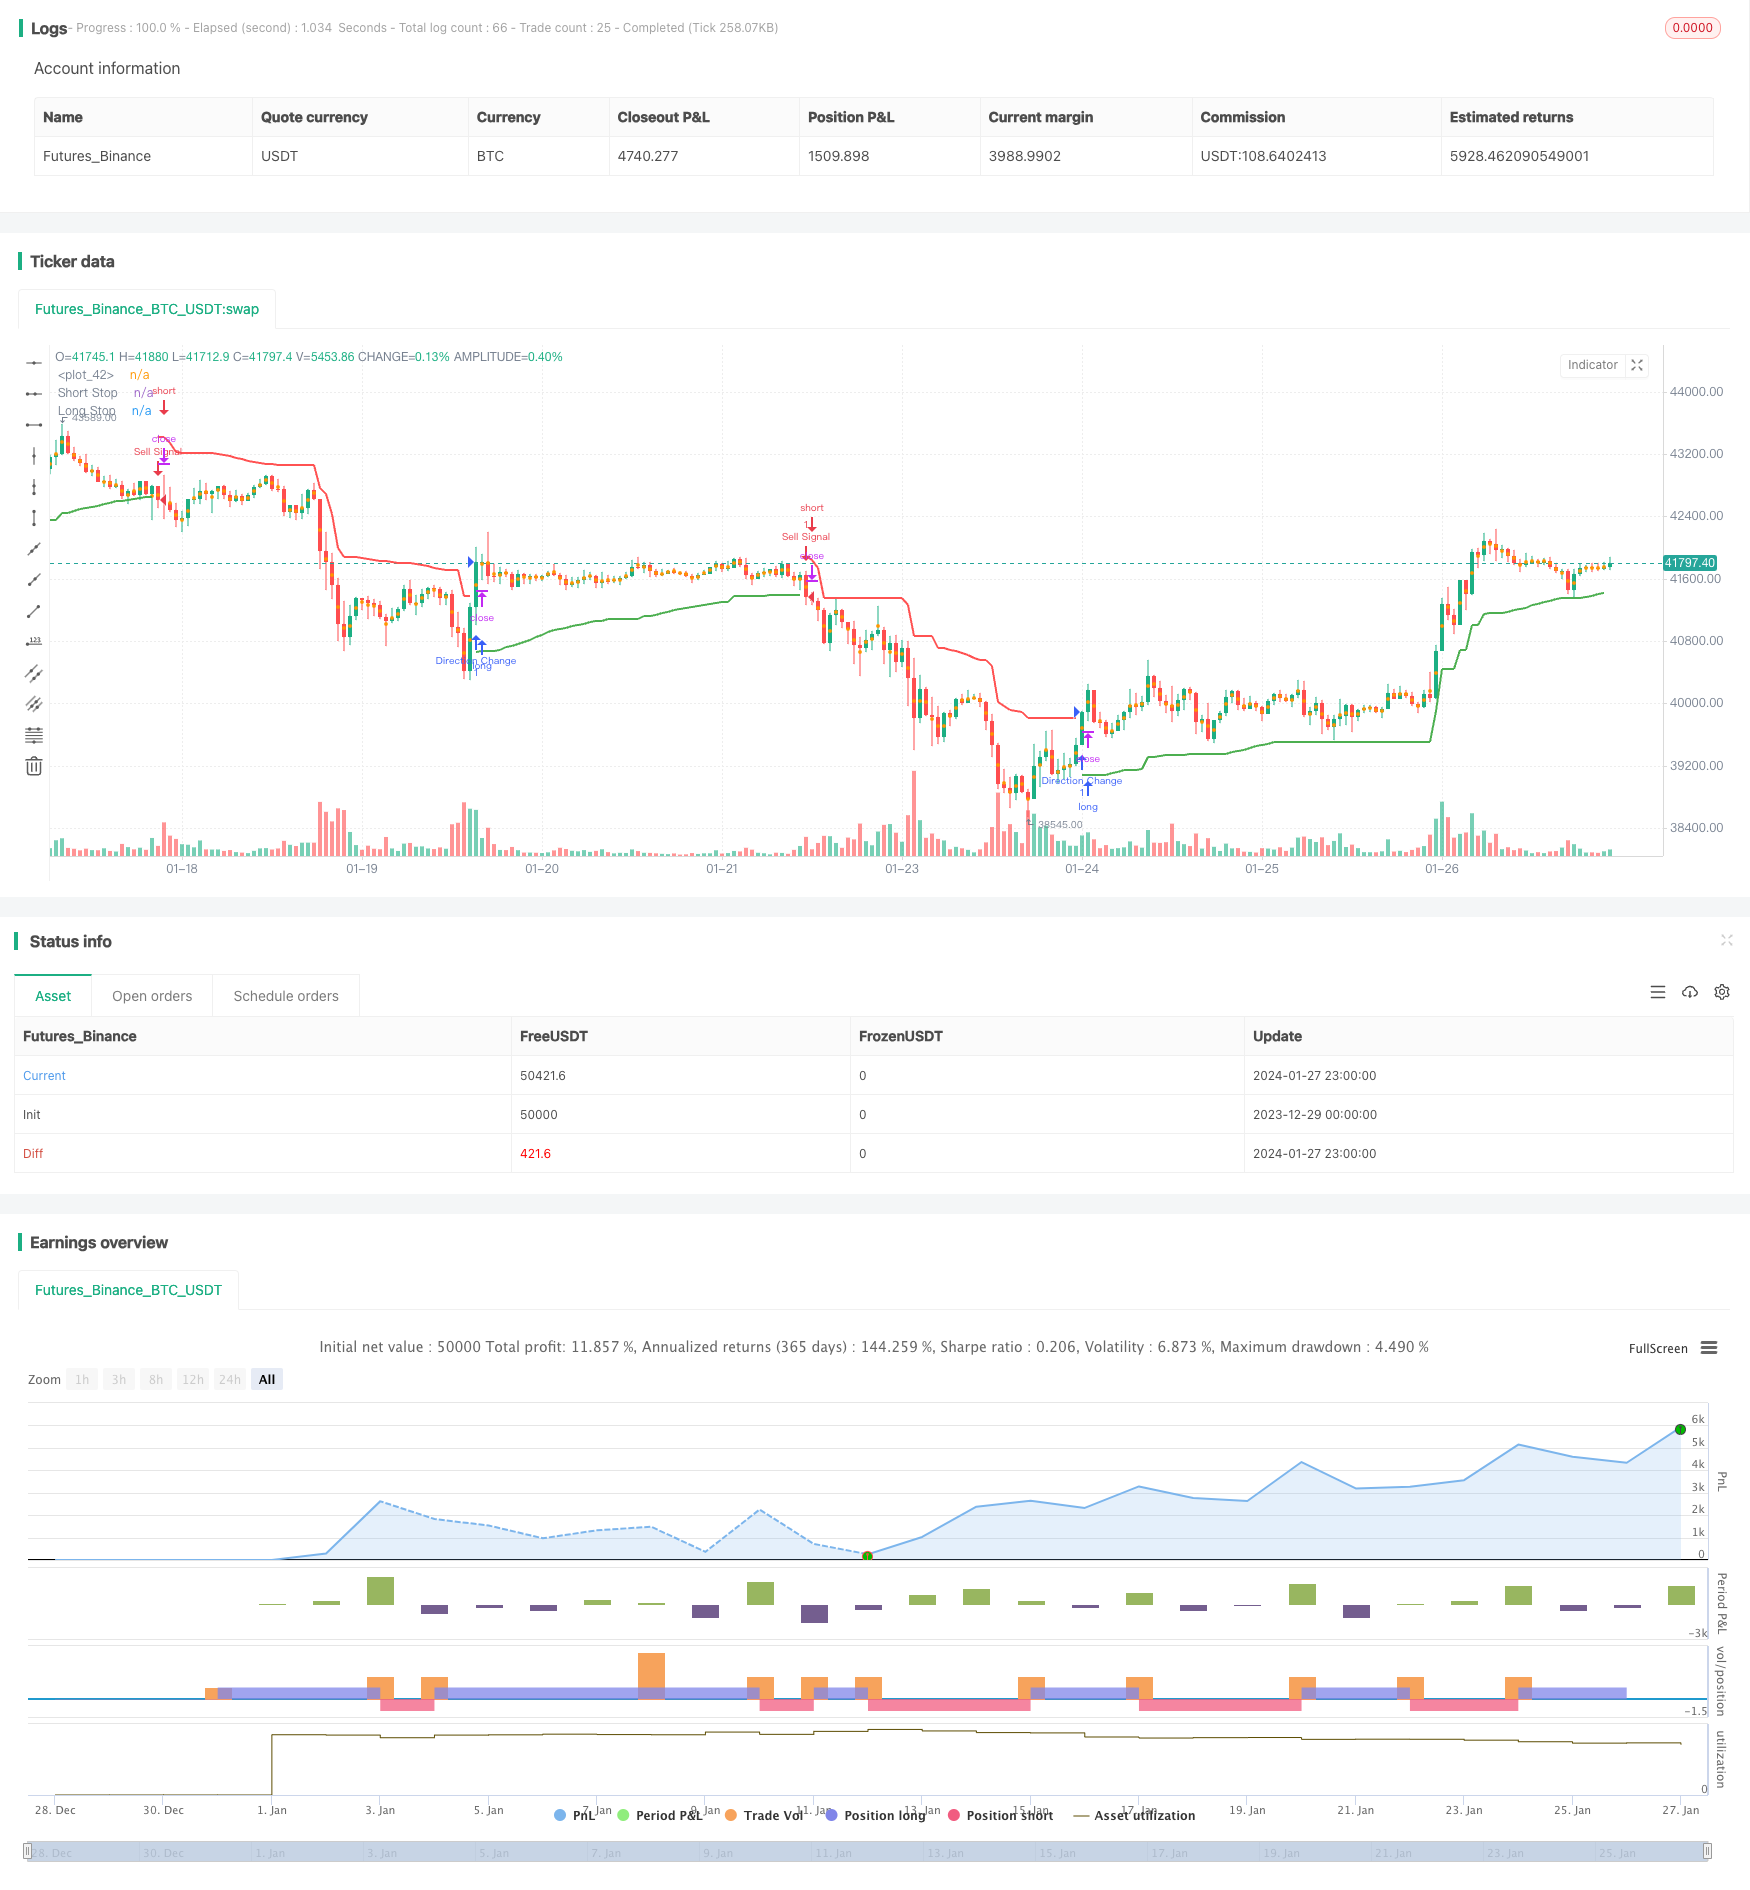
This strategy adopts the idea of dynamic trailing stop based on ATR and price extremes to calculate long and short stop-loss lines. Combined with the Chandelier Exit idea, it judges the long/short direction based on the stop-loss line breakout. When the stop-loss line breaks out upwards, it is judged as bullish and long entry. When the stop-loss line breaks out downwards, it is judged as bearish and short entry.
The strategy has both stop-loss management and entry signal judgment functionalities.
Strategy Logic
The strategy consists of the following main parts:
-
Calculate long/short stop-loss lines based on ATR
Based on user defined ATR period length and multiplier mult, real-time ATR is calculated. Then the long/short stop-loss lines are calculated with ATR and price extremes:
longStop = Highest - ATR shortStop = Lowest + ATR -
Judge the trading direction by breakout
Compare the stop-loss lines between the previous bar and the current bar. If the current bar’s stop-loss line breaks out, trading signals are triggered:
Long stop-loss line breakout upwards, long entry Short stop-loss line breakout downwards, short entry -
Set stop loss and take profit based on risk-reward ratio
Based on the user defined risk-reward ratio riskRewardRatio, stop loss distance and take profit distance are calculated from ATR. Stop loss order and take profit order are set when opening positions.
Advantage Analysis
The advantages of this strategy include:
-
Dynamic trailing stop loss
Adopting dynamic trailing stop loss lines helps timely stop loss and control downside risk.
-
Dual functions
The stop loss line serves as both stop loss management tool and entry condition judge, reducing strategy complexity.
-
Customizable risk-reward ratio
Pursue higher profit with predefined risk-reward ratio.
-
Easy to understand and extend
Simple structure, easy to understand and optimize for extension.
Risk Analysis
Some risks may exist for this strategy:
-
Two-way risks
As a dual-direction trading strategy, it undertakes both long and short risks.
-
ATR parameter dependency
ATR parameters directly impact the stop loss lines and trading frequency. Improper settings may result in either too wide stop loss or too high trading frequency.
-
Trend adaptiveness
The strategy fits better for range-bound scenarios with sudden breakouts. Not suitable for strong trending scenarios.
The optimizations to address the above risks are:
-
Incorporate trend indicators
Incorporate MA and other trend indicators to determine market trend, avoid trading against trends.
-
Parameter optimization
Optimize the combinations of ATR parameters and risk-reward ratio for more reasonable stop loss and take profit.
-
Additional filters
Add trading volume or volatility condition filters to ensure trading quality.
Optimization Directions
There are still rooms to optimize the strategy further:
-
Incorporate machine learning
Adopt machine learning models to predict price trend for higher entry accuracy.
-
Construct risk-free portfolio with Options
Use Options to hedge the price fluctuation of underlying assets and construct risk-free arbitrage portfolios.
-
Cross market multi-asset arbitrage
Conduct statistical arbitrage cross different markets and asset classes to obtain steady alpha.
-
Algorithm trading
Leverage algorithm trading engines to efficiently backtest strategies and trade.
Conclusion
This article thoroughly analyzes a quantitative trading strategy based on dynamic trailing stop loss. The strategy simultaneously has stop loss management functionality and trading signal determination, which effectively controls risks. We also discussed the advantages, potential risks and future optimizations of the strategy. It is a very practical trading strategy worth further research and application.
/*backtest
start: 2023-12-29 00:00:00
end: 2024-01-28 00:00:00
period: 1h
basePeriod: 15m
exchanges: [{"eid":"Futures_Binance","currency":"BTC_USDT"}]
*/

//@version=5
strategy("Chandelier Exit with 1-to-1 Risk-Reward", shorttitle='CE', overlay=true)

// Chandelier Exit Logic
length = input.int(title='ATR Period', defval=22)
mult = input.float(title='ATR Multiplier', step=0.1, defval=3.0)
useClose = input.bool(title='Use Close Price for Extremums', defval=true)

atr = mult * ta.atr(length)

longStop = (useClose ? ta.highest(close, length) : ta.highest(length)) - atr
longStopPrev = nz(longStop[1], longStop)
longStop := close[1] > longStopPrev ? math.max(longStop, longStopPrev) : longStop

shortStop = (useClose ? ta.lowest(close, length) : ta.lowest(length)) + atr
shortStopPrev = nz(shortStop[1], shortStop)
shortStop := close[1] < shortStopPrev ? math.min(shortStop, shortStopPrev) : shortStop

var int dir = 1
dir := close > shortStopPrev ? 1 : close < longStopPrev ? -1 : dir

// Risk-Reward Ratio
riskRewardRatio = input.int(1, title="Risk-Reward Ratio", minval=1, maxval=10, step=1)

// Calculate Take Profit and Stop Loss Levels
takeProfitLevel = atr * riskRewardRatio
stopLossLevel = atr

// Entry Conditions
longCondition = dir == 1 and dir[1] == -1
shortCondition = dir == -1 and dir[1] == 1

// Entry Signals
if (longCondition)
    strategy.entry("Long", strategy.long, stop=close - stopLossLevel, limit=close + takeProfitLevel)
if (shortCondition)
    strategy.entry("Short", strategy.short, stop=close + stopLossLevel, limit=close - takeProfitLevel)

longStopPlot = plot(dir == 1 ? longStop : na, title='Long Stop', style=plot.style_linebr, linewidth=2, color=color.green)
shortStopPlot = plot(dir == 1 ? na : shortStop, title='Short Stop', style=plot.style_linebr, linewidth=2, color=color.red)

midPricePlot = plot(ohlc4, title='', style=plot.style_circles, linewidth=0, display=display.none, editable=false)

fill(midPricePlot, longStopPlot, color=color.new(color.green, 90), title='Long State Filling')
fill(midPricePlot, shortStopPlot, color=color.new(color.red, 90), title='Short State Filling')

// Alerts
if (dir != dir[1])
    strategy.entry("Direction Change", strategy.long, comment="Chandelier Exit has changed direction!")
if (longCondition)
    strategy.entry("Buy Signal", strategy.long, comment="Chandelier Exit Buy!")
if (shortCondition)
    strategy.entry("Sell Signal", strategy.short, comment="Chandelier Exit Sell!")
- Breakout Reversal Model Based on Turtle Trading Strategy
- Momentum Trend Strategy
- Peanut 123 Reversal and Breakout Range Short-term Trading Strategy
- Smoothed RSI Based Stock Trading Strategy
- Smooth Volatility Band Strategy
- Commodity Channel Index Reversal Trading Strategy
- Time-based Strategy with ATR Take Profit
- Momentum Trend Tracker Strategy
- EMA Candle Close Strategy
- EMA Crossover Quantitative Trading Strategy
- Mean Reversion with Incremental Entry Strategy
- Dynamic Average Price Tracking Strategy
- Williams Fractals Combined with ZZ Indicator for Quantitative Trading Strategies
- Multi-factor Trend Trading Strategy
- Dual Moving Average Crossover Trading Strategy
- Volume-based Trend Following Trading Strategy
- Significant Pivot Points Reversal Strategy
- FNGU Quantitative Trading Strategy Based on Bollinger Bands and RSI
- Bollinger Bands RSI OBV Strategy
- P-Signal Reversal Strategy