EMA Crossover Quantitative Trading Strategy
Author: ChaoZhang, Date: 2024-01-29 15:56:56Tags:

Overview
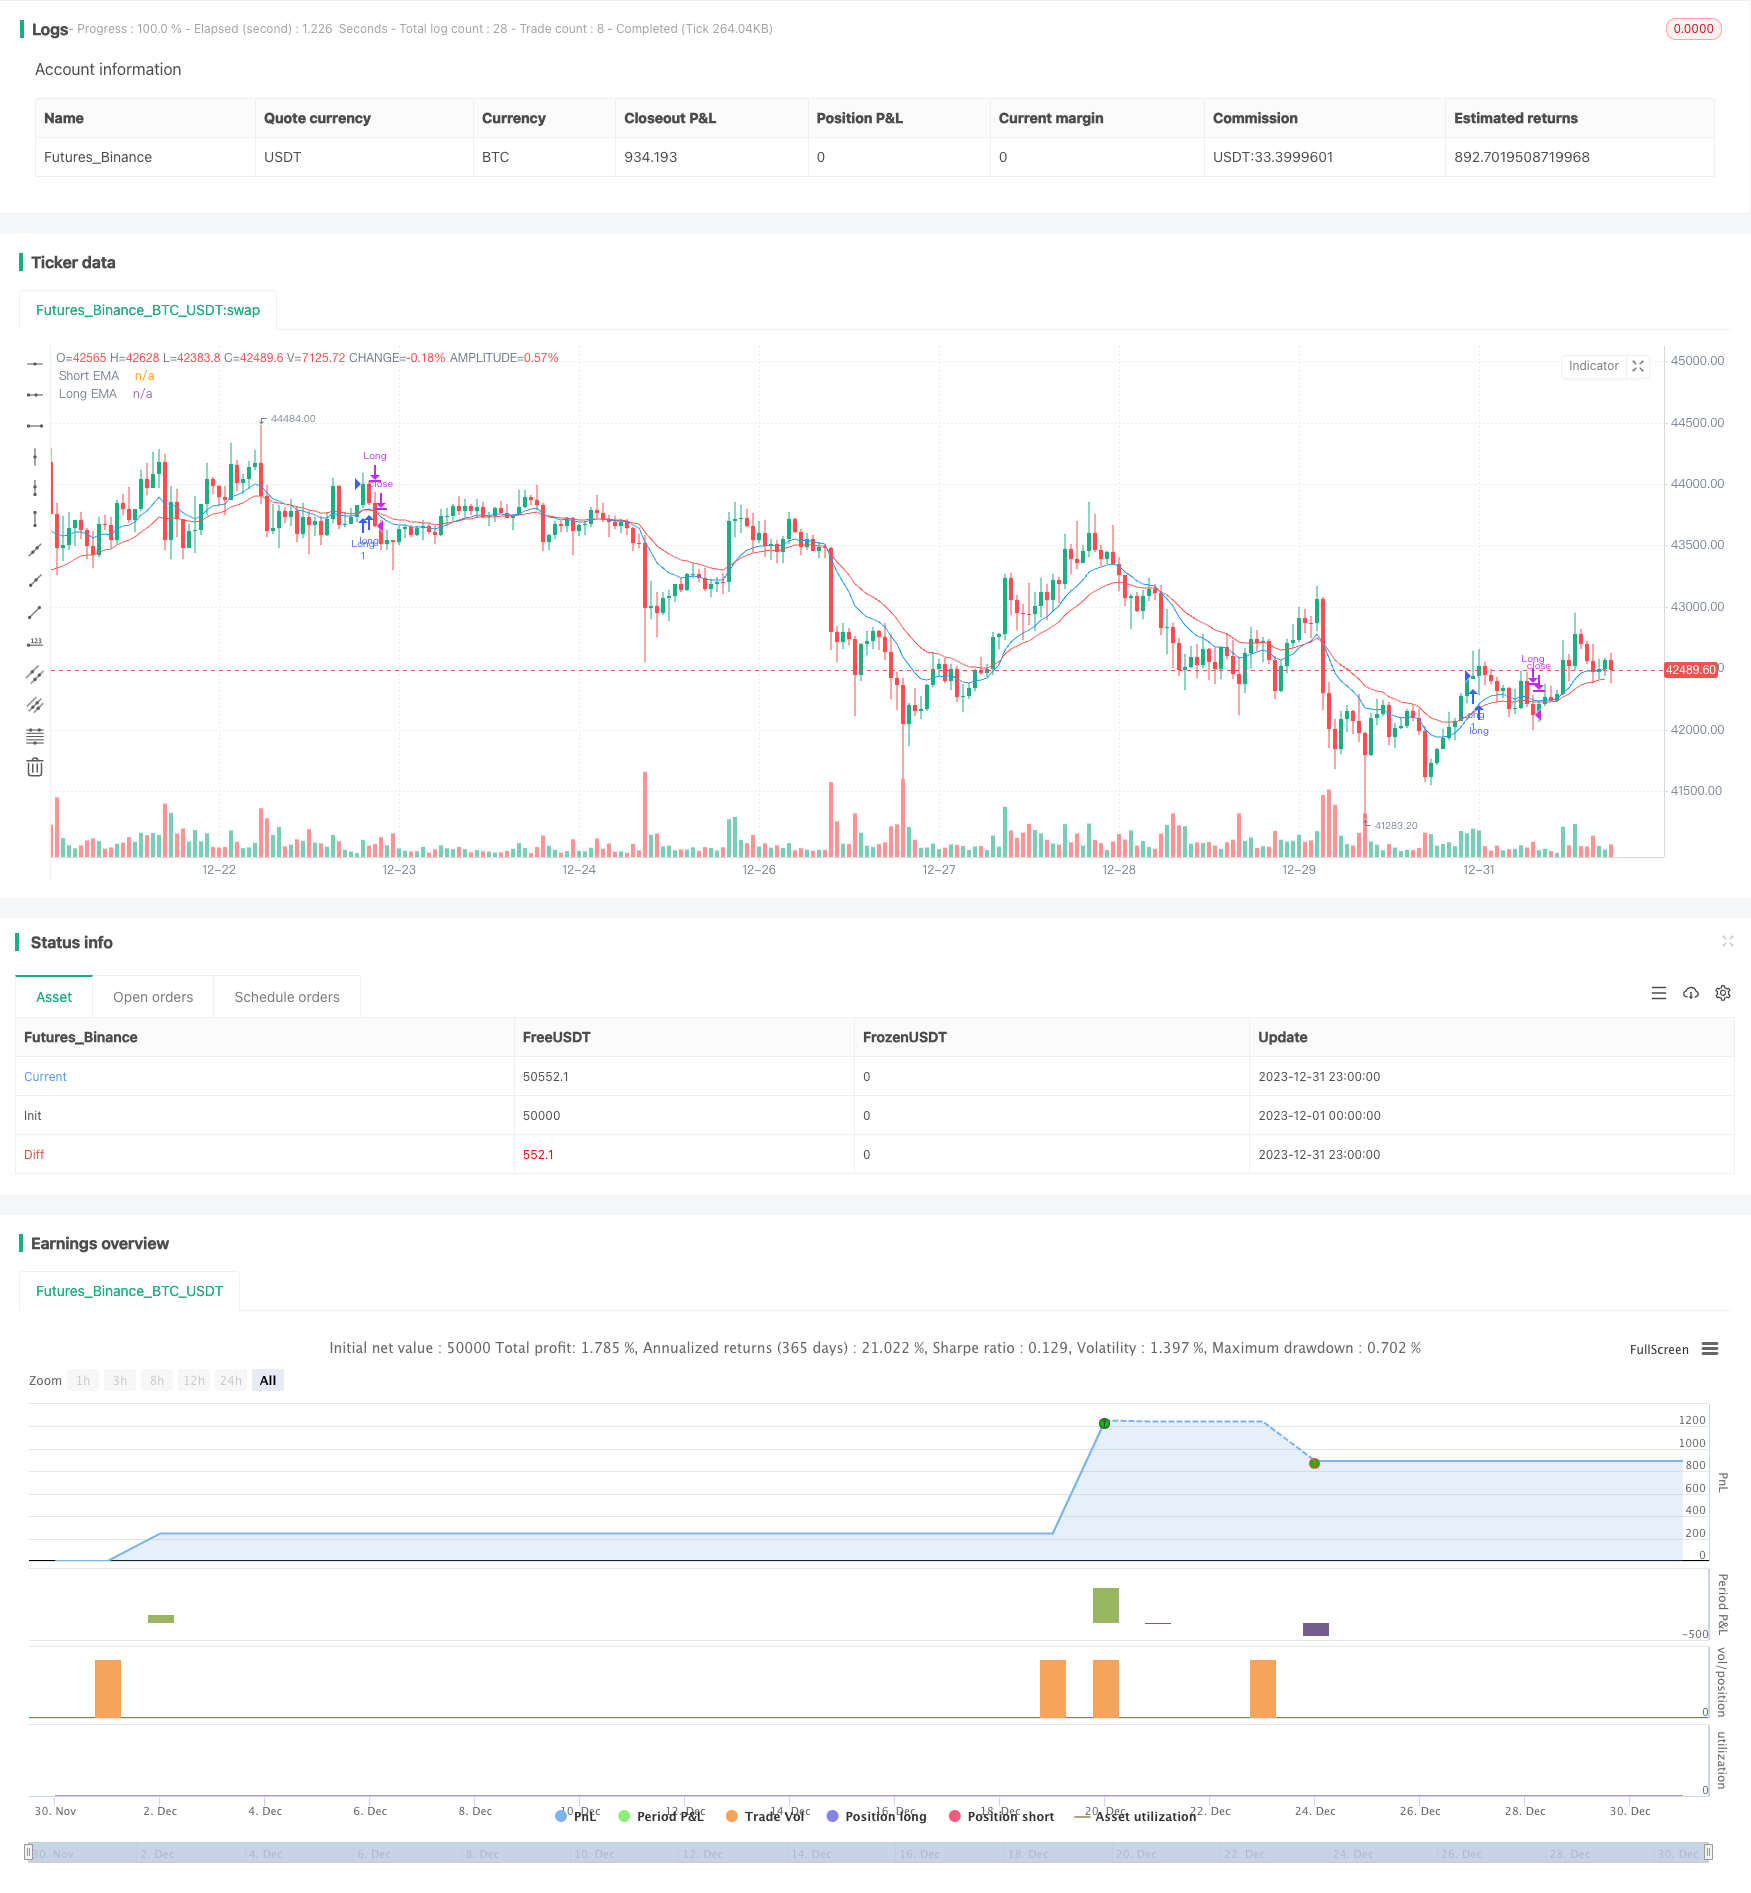
This is an EMA crossover quantitative trading strategy. It uses two EMAs with different periods as trading signals, going long when the shorter period EMA crosses over the longer period EMA and going short when the shorter period EMA crosses below the longer period EMA. It belongs to the trend following strategies. This strategy also sets stop loss and take profit to control risks.
Strategy Logic
This strategy uses the golden cross and death cross of EMAs as trading signals. Specifically, it calculates the shorter period EMA and longer period EMA respectively. When the shorter period EMA crosses over the longer period EMA, it generates a buy signal for going long. When the shorter period EMA crosses below the longer period EMA, it generates a sell signal for going short. So the moving trends of EMAs determine the trading directions.
After entering positions, the strategy also sets stop loss and take profit simultaneously. The stop loss is a certain percentage of the entry price as the stop loss line. If the price touches the stop loss line, it will exit the position for stop loss. The take profit is a certain percentage of the entry price as the take profit line. If the price touches the take profit line, it will exit the position for taking profit.
This strategy also allows choosing only long, only short, intraday trading or position trading. For intraday trading, it will close all positions before market close.
Advantage Analysis
This strategy has the following advantages:
-
Using EMA indicator to filter noises and catch mid-long term trends smoothly.
-
Adopting EMA crossovers between shorter and longer periods as trading signals to avoid over-trading.
-
Setting stop loss and take profit to control risk-reward ratio of every trade, which is good for money management.
-
Allowing only long, only short, intraday and position trading to suit different trader types.
-
Supporting multiple trading assets like stocks, forex, cryptocurrencies etc.
Risk Analysis
This strategy also has some potential risks:
-
EMA indicator has lagging effect and may miss some short term trend turning points.
-
Inappropriate choices of shorter and longer EMA periods may cause messy trading signals.
-
Holding positions for too long may undertake larger market fluctuations.
-
Mechanical stop loss and take profit may exit positions too early or reduce profits prematurely.
The corresponding risk management measurements:
-
Optimize EMA parameters to find the best period combination.
-
Add other indicators as auxiliary judgement.
-
Dynamically adjust stop loss and take profit.
-
Manual intervene unusual market condition.
Optimization Directions
This strategy can be optimized in the following aspects:
-
Best optimization of EMA parameters to find suitable shorter and longer period combinations for different trading assets.
-
Add other indicators like MACD, KD for multi-indicator synergy.
-
Add machine learning models to generate dynamic stop loss and take profit.
-
Connect more advanced RISK indicators for feature engineering.
-
Add adaptive trading components for parameter self-optimization.
Summary
In summary, this is an excellent trend following strategy template. Its core strength lies in using EMA indicator to filter noises and achieve steady profits, while possessing comprehensive risk-reward management. Through continuous optimization, this strategy can become a universal quantitative strategy across markets and is worthwhile for traders to learn and practice.
/*backtest
start: 2023-12-01 00:00:00
end: 2023-12-31 23:59:59
period: 1h
basePeriod: 15m
exchanges: [{"eid":"Futures_Binance","currency":"BTC_USDT"}]
*/

//@version=5
strategy("EMA Crossover Strategy by Vikrant Singh", overlay=true)


// Input for EMA Lengths
var bool runningPOS = false
var float stopLossLevel = na
var float targetLevel = na
shortLength = input(11, title="Short EMA Length")
longLength = input(21, title="Long EMA Length")

// Input for Stop-Loss and Target
stopLossPct = input(1, title="Stop-Loss (%)")
targetPct = input(3, title="Target (%)")
longOnly = input(true, title="Long Only")
intraDay = input(true, title="intraday?")


// Calculate EMAs
emaShort = ta.ema(close, shortLength)
emaLong = ta.ema(close, longLength)

// Calculate crossover conditions
crossoverCondition = ta.crossover(emaShort, emaLong)
crossunderCondition = ta.crossunder(emaShort, emaLong)

// Entry condition (long position just before crossover)
if crossoverCondition and not runningPOS and longOnly and (hour <= 15)
    strategy.entry("Long", strategy.long)
    runningPOS := true
    stopLossLevel := close * (1 - stopLossPct / 100)
    targetLevel := close * (1 + targetPct / 100)

//Entry condition (short position just before crossover)
if crossunderCondition and not runningPOS and not longOnly and (hour <= 15)
    strategy.entry("Short", strategy.short)
    runningPOS := true
    stopLossLevel := close * (1 + stopLossPct / 100)
    targetLevel := close * (1 - targetPct / 100)

// Exit conditions (square off on reverse crossover)
//Exit long
if (crossunderCondition or (low < stopLossLevel) or (high > targetLevel) ) and longOnly and runningPOS
    strategy.close("Long",comment = "Exit long")// ("Long", from_entry="Long",stop=stopLossLevel, limit=targetLevel)
    runningPOS := false

//Exit short
if (crossoverCondition or (high > stopLossLevel) or (low < targetLevel) ) and not longOnly and runningPOS
    strategy.close("Short", comment = "Exit Short")
    runningPOS := false

if intraDay and runningPOS
    if (hour >= 15)
        strategy.close_all(comment = "Intraday square off")
        //strategy.close("Long",comment = "intraday square off")
        runningPOS := false


// Plot EMAs
plot(emaShort, color=color.blue, title="Short EMA")
plot(emaLong, color=color.red, title="Long EMA")
- Trend Tracking Moving Average Crossover Strategy
- Breakout Reversal Model Based on Turtle Trading Strategy
- Momentum Trend Strategy
- Peanut 123 Reversal and Breakout Range Short-term Trading Strategy
- Smoothed RSI Based Stock Trading Strategy
- Smooth Volatility Band Strategy
- Commodity Channel Index Reversal Trading Strategy
- Time-based Strategy with ATR Take Profit
- Momentum Trend Tracker Strategy
- EMA Candle Close Strategy
- Dynamic Stop-Loss Moving Average Strategy
- Mean Reversion with Incremental Entry Strategy
- Dynamic Average Price Tracking Strategy
- Williams Fractals Combined with ZZ Indicator for Quantitative Trading Strategies
- Multi-factor Trend Trading Strategy
- Dual Moving Average Crossover Trading Strategy
- Volume-based Trend Following Trading Strategy
- Significant Pivot Points Reversal Strategy
- FNGU Quantitative Trading Strategy Based on Bollinger Bands and RSI
- Bollinger Bands RSI OBV Strategy