EMA Candle Close Strategy
Author: ChaoZhang, Date: 2024-01-29 16:02:08Tags:

Overview
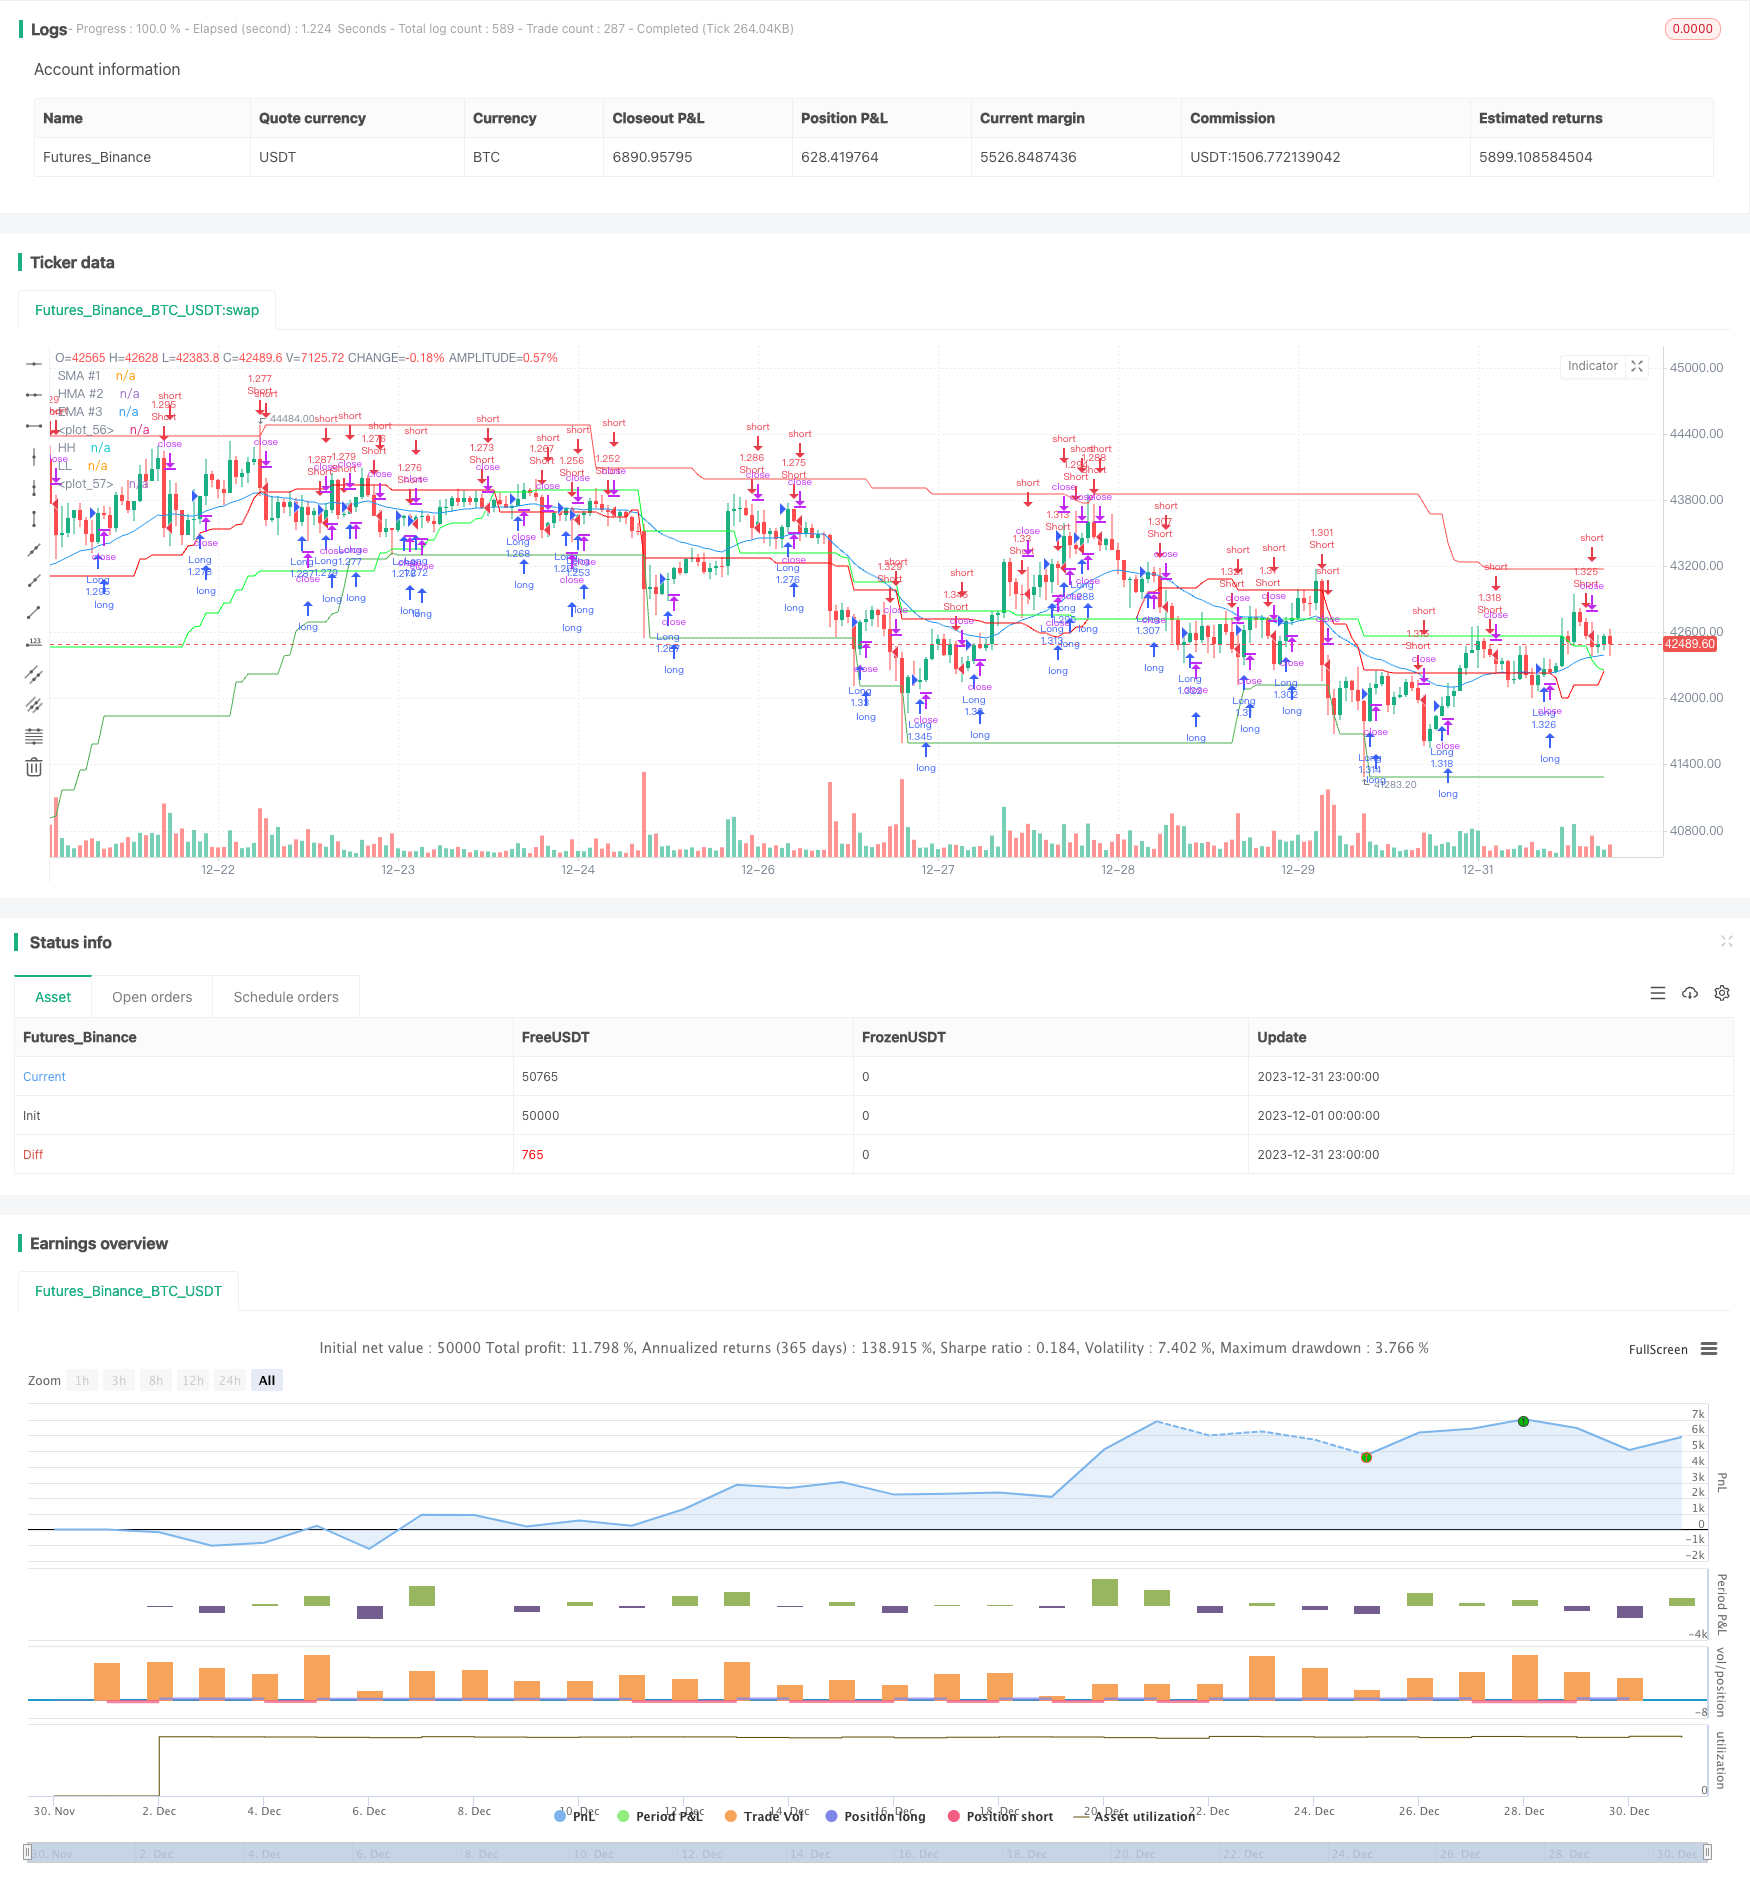
This strategy generates trading signals based on the golden cross and dead cross of moving averages. It incorporates three moving averages with different parameter settings - short-term, medium-term and long-term ones. By comparing the height relationship among these three MAs, it determines the bullish/bearish state of the market and produces trading signals.
Strategy Principle
The strategy sets three moving average lines, which are a short-term simple moving average, a medium-term weighted moving average and a long-term exponential moving average. Specifically, it sets a 1-period SMA, a 20-period WMA and a 25-period EMA.
When the short-term SMA line crosses over the medium-term WMA line upwardly and the closing price is also higher than the WMA line, it indicates the market is reversing upward and forms a bullish signal. When the short-term SMA crosses below the medium-term WMA or the closing price is lower than the WMA, it gives a bearish signal. Therefore, this strategy judges the bullish/bearish state of the market by comparing the height and crossover among the three MAs.
Advantage Analysis
The strategy incorporates three MAs of short, medium and long terms, which can react to market changes in different cycles and improve the accuracy of capturing trends. Especially, the medium-term WMA has a better effect of filtering out market noise and avoids wrong signals effectively. In addition, the strategy only sends long signals when the bullish signals of SMA and closing price reach high consistency, which prevents whipsaws and ensures every entry efficient.
Risk Analysis
The strategy has the risk of false signals. When the short-term SMA produces wrong signals, unnecessary losses may be caused due to the strategy’s strict dependence on the SMA line. Also, the strategy is sensitive to parameters. When parameters are set improperly under range-bound markets, many wrong trades can be triggered.
To prevent such risks, it’s suggested to adjust the MA lengths, properly loosen trading conditions and set stop loss to limit single loss. When the market trend is unclear, the strategy can be stopped temporarily.
Optimization Directions
The strategy can be optimized from the following aspects:
-
Incorporate more types of MAs like KC to form an indicator portfolio to improve accuracy
-
Add volume factors like breakout with high volume
-
Combine volatility indicators to avoid failure in choppy markets
-
Employ machine learning to train and optimize parameters
Conclusion
The strategy determines market bullish/bearish status based on the crossover and height relationship among three MAs and closing prices. By combining MAs of different terms, it can effectively discover trends and the signals are of high quality. With proper parameter tuning and introducing more auxiliary indicators, the strategy can be further enhanced in pertinence and stability.
/*backtest
start: 2023-12-01 00:00:00
end: 2023-12-31 23:59:59
period: 1h
basePeriod: 15m
exchanges: [{"eid":"Futures_Binance","currency":"BTC_USDT"}]
*/

//@version=5
strategy("EMA Candle Close Strategy KHANH 11/11/2023", overlay=true, initial_capital=100, commission_type=strategy.commission.percent, commission_value=0.0000005, default_qty_type=strategy.percent_of_equity, default_qty_value=100)

len1 = input.int(1, title="SMA #1 Length", minval=1)
src1 = input(close, title="SMA Source #1")
out1 = ta.sma(src1, len1)
plot(out1, title="SMA #1", color=close >= out1 ? color.rgb(120, 123, 134, 100) : color.rgb(120, 123, 134, 100), linewidth=1)

len2 = input.int(20, title="HMA #2 Length", minval=1)
src2 = input(close, title="HMA Source #2")
out2 = ta.hma(src2, len2)
plot(out2, title="HMA #2", color=close >= out2 ? color.rgb(253, 255, 254, 100) : color.rgb(255, 255, 255, 100), linewidth=1)

len3 = input.int(25, title="EMA #3 Length", minval=1)
src3 = input(close, title="EMA Source #3")
out3 = ta.ema(src3, len3)
plot(out3, title="EMA #3", color=close >= out3 ? color.blue : color.blue, linewidth=1)

// Define the long condition
longCondition = (out1 > out2 and close > out2)

// Define the short condition
shortCondition = (out1 < out2 or close < out2)

// Entry conditions
if (longCondition)
    strategy.entry("Long",strategy.long)
else if (shortCondition)
    strategy.entry("Short", strategy.short)

// Trade channel plot
PeriodLookBack = input(55, title="Period Look Back")
xHighest55 = request.security(syminfo.tickerid, timeframe.period, ta.highest(PeriodLookBack))
xLowest55 = request.security(syminfo.tickerid, timeframe.period, ta.lowest(PeriodLookBack))
plot(xHighest55[1], color=color.red, title="HH")
plot(xLowest55[1], color=color.green, title="LL")


//@version=5
//indicator("Custom Moving Averages", shorttitle="CMA", overlay=true)

shortLength = input(defval=40, title="Short Length")
longLength = input(defval=80, title="Long Length")

// Sử dụng khung thời gian của biểu đồ đang sử dụng thay vì cố định là "D"
shortTopBorder = request.security(syminfo.tickerid, timeframe.period, ta.highest(high, shortLength))
shortBottomBorder = request.security(syminfo.tickerid, timeframe.period, ta.lowest(low, shortLength))

longTopBorder = request.security(syminfo.tickerid, timeframe.period, ta.highest(high, longLength))
longBottomBorder = request.security(syminfo.tickerid, timeframe.period, ta.lowest(low, longLength))

shortAverageLine = (shortTopBorder + shortBottomBorder) / 2
longAverageLine = (longTopBorder + longBottomBorder) / 2

plot(shortAverageLine, color=color.new(#fc0000, 0))
plot(longAverageLine, color=color.new(#01ff27, 0))
- Robust Trend Continuation Strategy
- Trend Tracking Moving Average Crossover Strategy
- Breakout Reversal Model Based on Turtle Trading Strategy
- Momentum Trend Strategy
- Peanut 123 Reversal and Breakout Range Short-term Trading Strategy
- Smoothed RSI Based Stock Trading Strategy
- Smooth Volatility Band Strategy
- Commodity Channel Index Reversal Trading Strategy
- Time-based Strategy with ATR Take Profit
- Momentum Trend Tracker Strategy
- EMA Crossover Quantitative Trading Strategy
- Dynamic Stop-Loss Moving Average Strategy
- Mean Reversion with Incremental Entry Strategy
- Dynamic Average Price Tracking Strategy
- Williams Fractals Combined with ZZ Indicator for Quantitative Trading Strategies
- Multi-factor Trend Trading Strategy
- Dual Moving Average Crossover Trading Strategy
- Volume-based Trend Following Trading Strategy
- Significant Pivot Points Reversal Strategy
- FNGU Quantitative Trading Strategy Based on Bollinger Bands and RSI