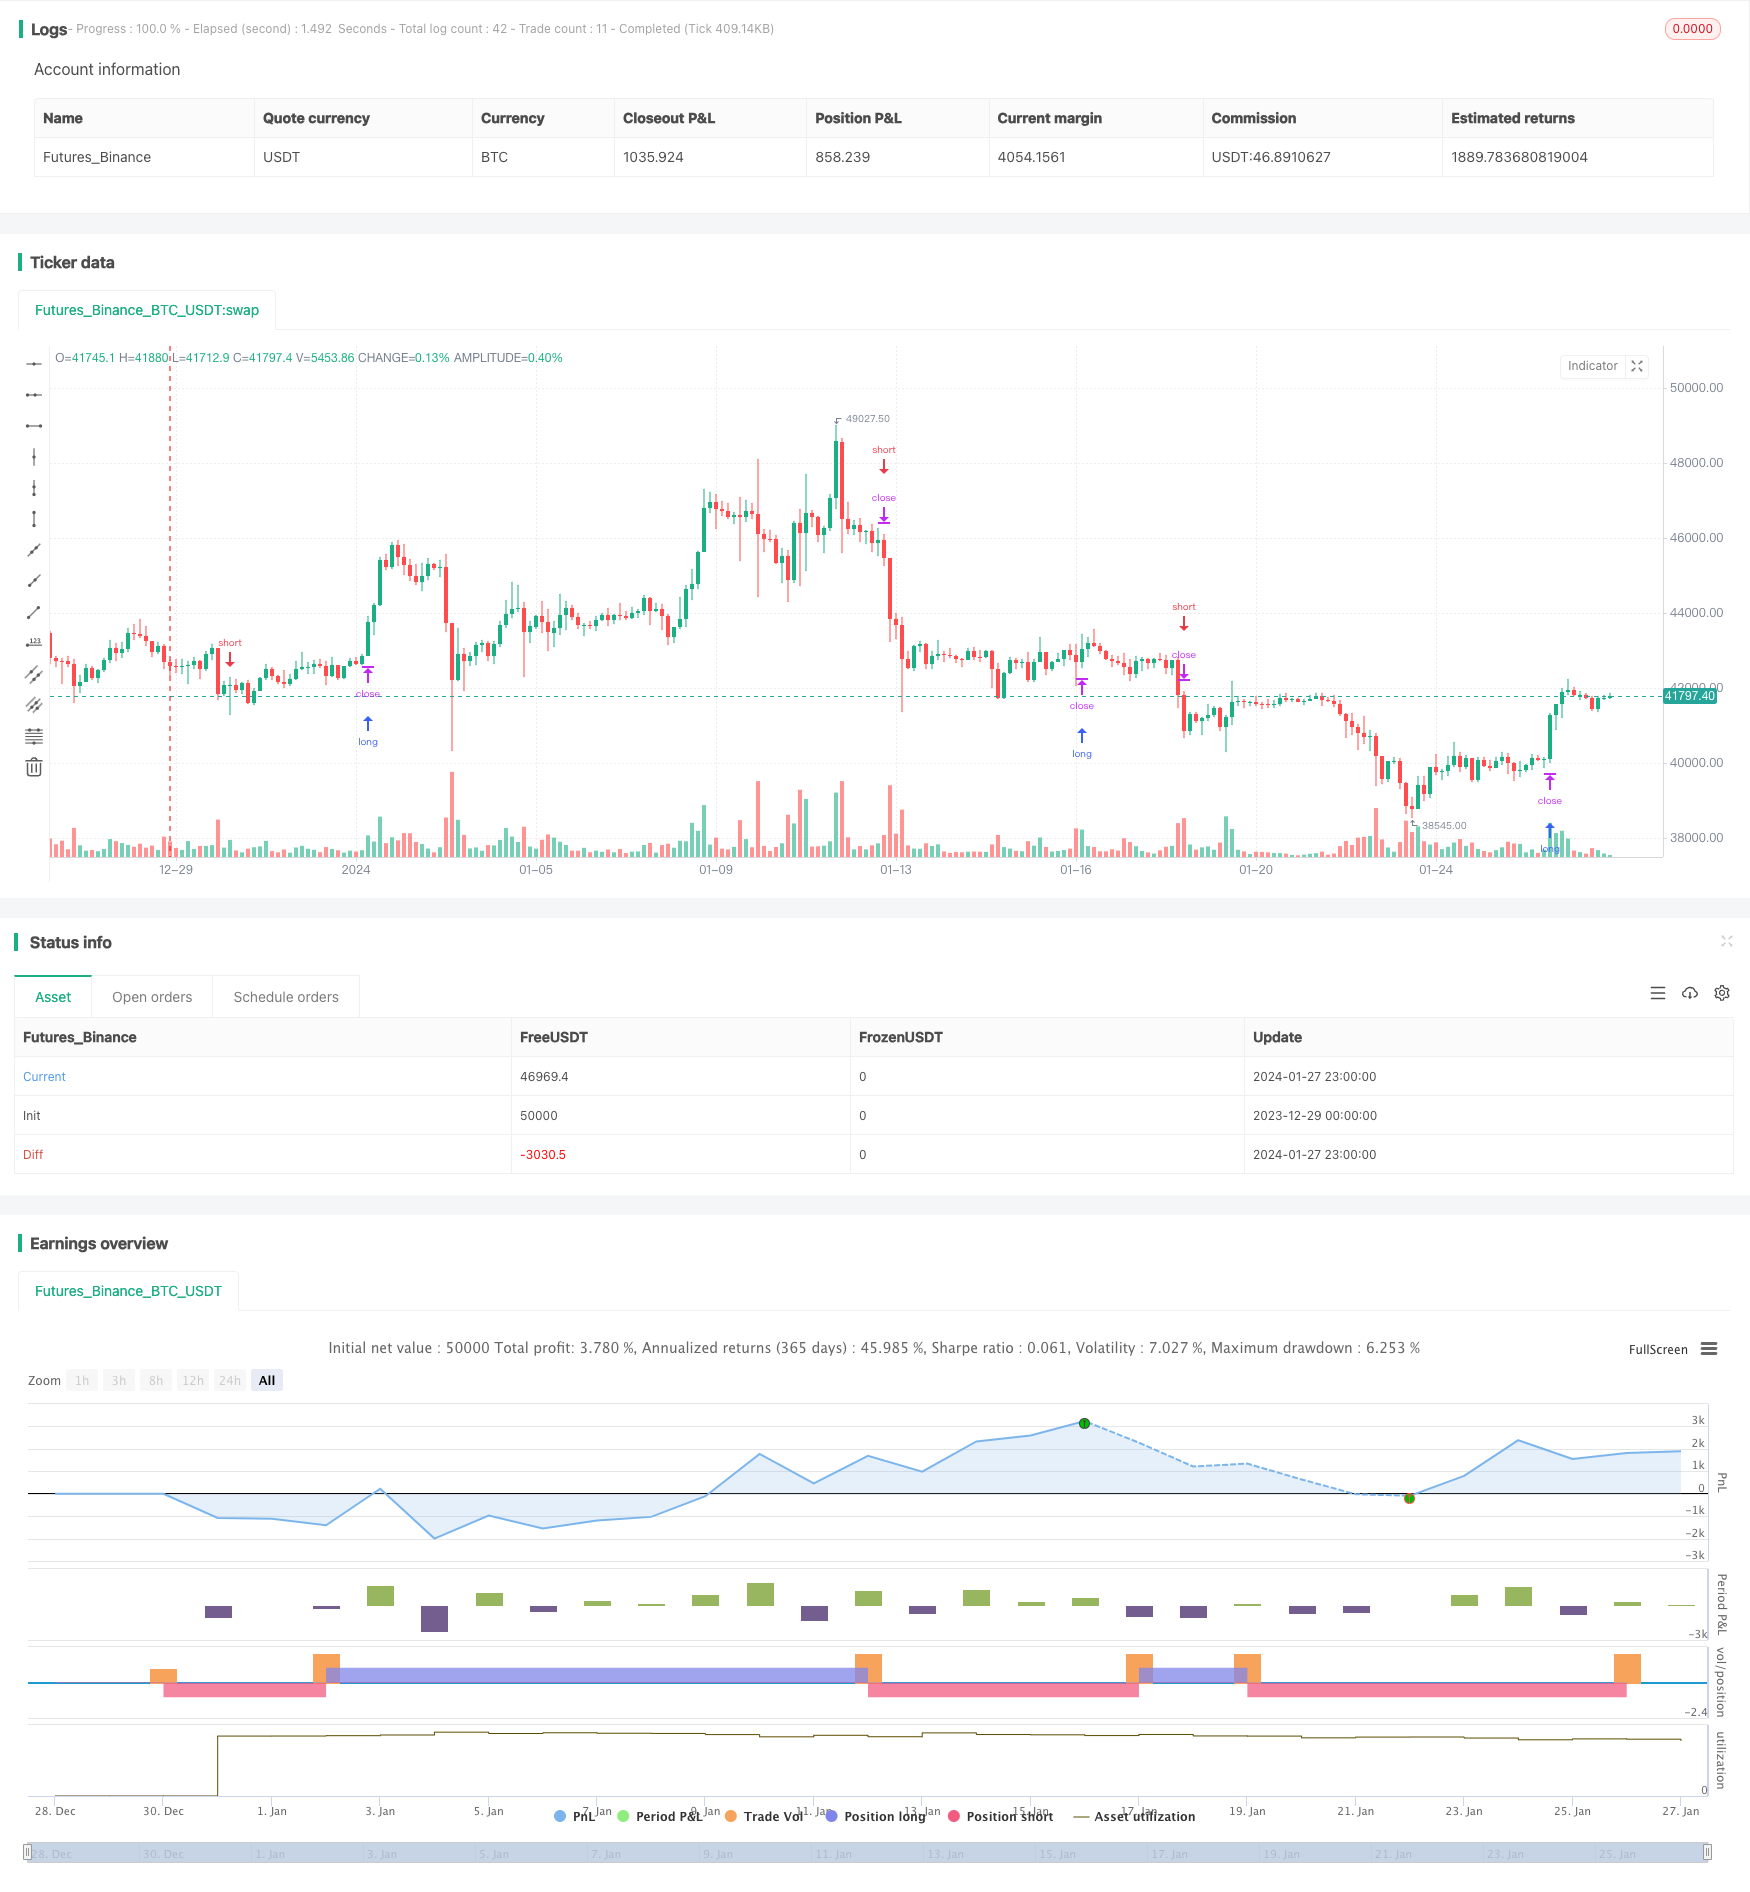
Momentum Trend Tracker Strategy
Author: ChaoZhang, Date: 2024-01-29 16:08:16Tags:

Overview
The “Momentum Trend Tracker” strategy is a meticulously crafted tool designed for traders who seek to leverage the confluence of volatility, trend, and momentum indicators for informed decision-making. The uniqueness of this strategy lies in its integration of Average True Range (ATR) for dynamic stop loss positioning, Simple Moving Average (SMA) for trend filtering, and Moving Average Convergence Divergence (MACD) for entry confirmation.
Strategy Logic
Volatility Assessment
The strategy employs ATR to dynamically adjust stop levels catering to changing market volatility. This approach ensures stop levels respond more sensitively to current market conditions, potentially reducing the risk of premature stop-outs.
Trend Filtering
By using an SMA, the strategy filters entries ensuring alignment with the overall market trend. This filter is crucial to avoid trades against the prevailing market direction, thus increasing the likelihood of successful trades.
Momentum Confirmation
The MACD indicator serves as a momentum filter, confirming trade entries by ensuring they coincide with the prevailing momentum. This additional layer of confirmation helps in filtering out false signals and enhances the strategy’s reliability.
Advantage Analysis
The integration of ATR, SMA, and MACD in the strategy is not merely a mashup of indicators. Instead, each component plays a critical role in the trade decision process from entry to exit. This holistic approach provides traders with a comprehensive strategy leveraging multiple market dimensions, offering a unique and valuable tool for trend-following and momentum-based trading.
Risk Analysis
The strategy relies heavily on indicator configurations, improper parameter tuning may lead to incorrect signals. Additionally, low SNR signals near trend inflection points may cause whipsaws. To mitigate these risks, parameter optimization is recommended along with incorporating other confirming indicators to improve robustness.
Optimization Directions
The strategy can be dynamically optimized by introducing machine learning algorithms to tune parameters according to current market conditions. Additionally, incorporating more data sources like news events, social media data, etc. may aid in judging market turning points and reduce late entries. Moreover, the strategy can be expanded across multiple timeframes or instruments to capture more trading opportunities.
Conclusion
The “Momentum Trend Tracker” strategy fully utilizes the strengths of multiple indicators to provide a valuable tool for trade decision-making. Excellent parameter tuning and market understanding are key to unlocking its value. Despite room for improvements, it offers experienced traders a unique perspective worth dedicating time and effort to test and optimize.
/*backtest
start: 2023-12-29 00:00:00
end: 2024-01-28 00:00:00
period: 3h
basePeriod: 15m
exchanges: [{"eid":"Futures_Binance","currency":"BTC_USDT"}]
*/

//@version=5
strategy("trend_hunter", overlay=true)

length = input(20, title="ATR Length")
numATRs = input(0.75, title="ATR Multiplier")
atrs = ta.sma(ta.tr, length) * numATRs

// Trend Filter
smaPeriod = input(32, title="SMA Period")
sma = ta.sma(close, smaPeriod)

// MACD Filter
macdShortTerm = input(12, title="MACD Short Term")
macdLongTerm = input(26, title="MACD Long Term")
macdSignalSmoothing = input(9, title="MACD Signal Smoothing")

[macdLine, signalLine, _] = ta.macd(close, macdShortTerm, macdLongTerm, macdSignalSmoothing)

// Long Entry with Trend and MACD Filter
longCondition = close > sma and close[1] <= sma[1] and macdLine > signalLine
strategy.entry("Long", strategy.long, stop=close + atrs, when=longCondition, comment="Long")

// Short Entry with Trend and MACD Filter
shortCondition = close < sma and close[1] >= sma[1] and macdLine < signalLine
strategy.entry("Short", strategy.short, stop=close - atrs, when=shortCondition, comment="Short")

//plot(strategy.equity, title="equity", color=color.red, linewidth=2, style=plot.style_area)
- Amazing Price Breakout Strategy
- Robust Trend Continuation Strategy
- Trend Tracking Moving Average Crossover Strategy
- Breakout Reversal Model Based on Turtle Trading Strategy
- Momentum Trend Strategy
- Peanut 123 Reversal and Breakout Range Short-term Trading Strategy
- Smoothed RSI Based Stock Trading Strategy
- Smooth Volatility Band Strategy
- Commodity Channel Index Reversal Trading Strategy
- Time-based Strategy with ATR Take Profit
- EMA Candle Close Strategy
- EMA Crossover Quantitative Trading Strategy
- Dynamic Stop-Loss Moving Average Strategy
- Mean Reversion with Incremental Entry Strategy
- Dynamic Average Price Tracking Strategy
- Williams Fractals Combined with ZZ Indicator for Quantitative Trading Strategies
- Multi-factor Trend Trading Strategy
- Dual Moving Average Crossover Trading Strategy
- Volume-based Trend Following Trading Strategy
- Significant Pivot Points Reversal Strategy