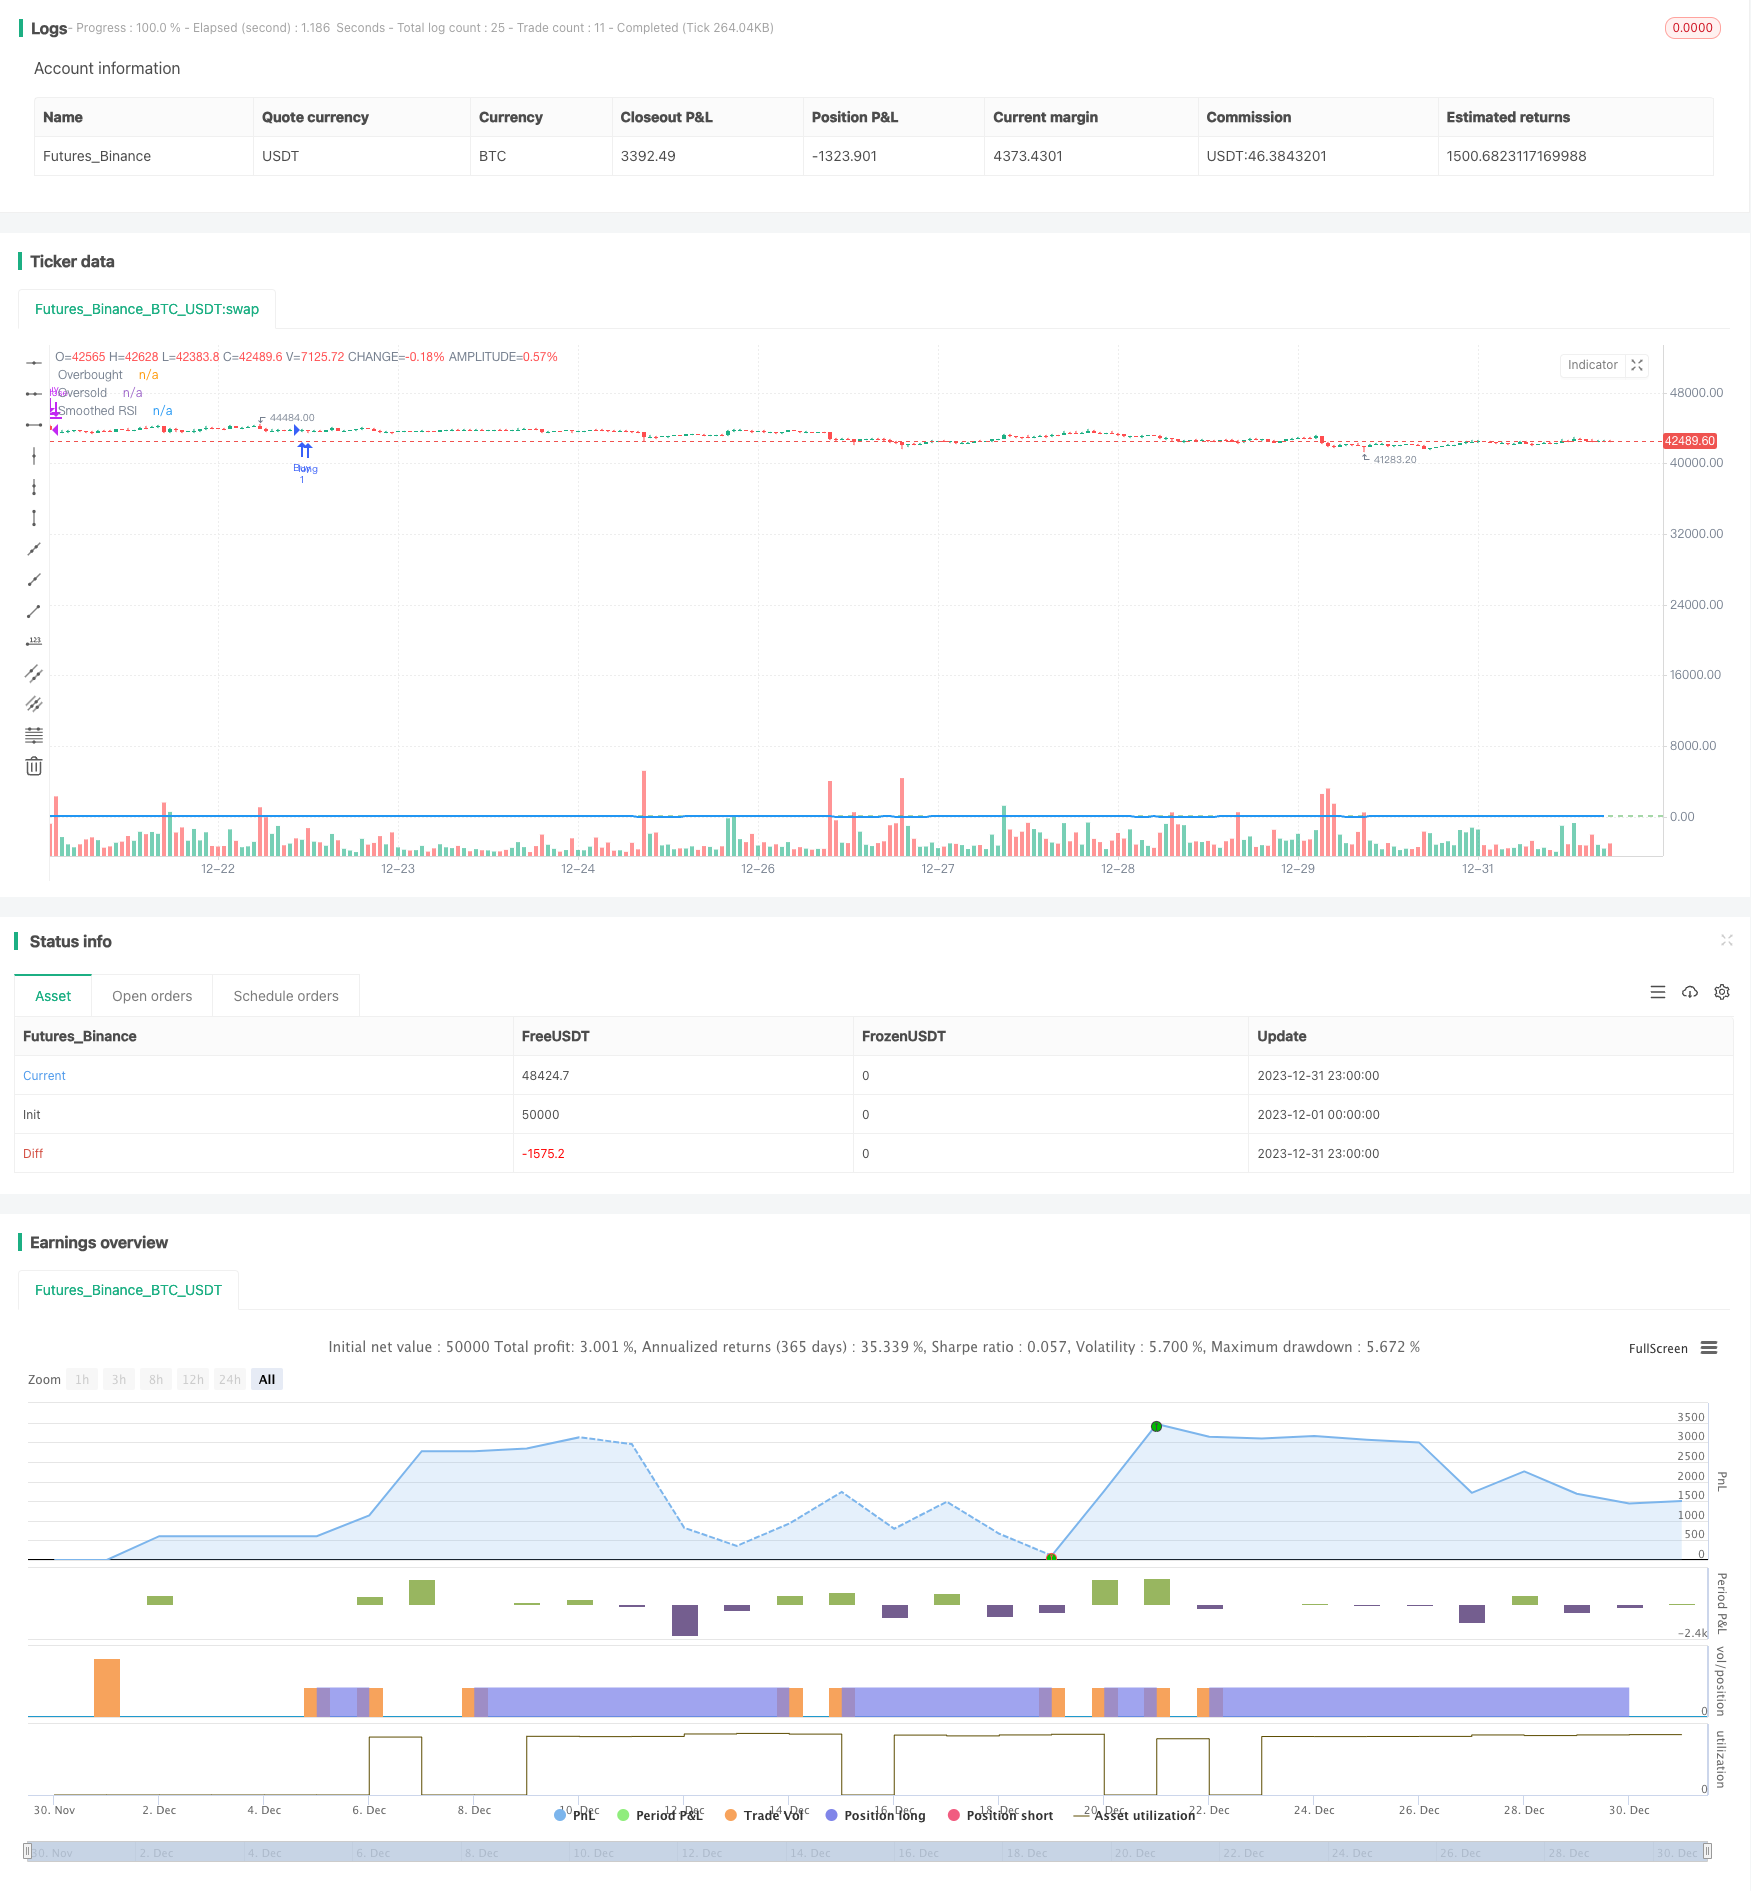
Overview
This strategy is based on the smoothed Relative Strength Index (RSI) to determine buy and sell signals, which is a typical trend following strategy. By calculating the magnitude of price rises and falls over a period of time, it helps investors judge whether the market is overbought or oversold, and make investment decisions accordingly.
Strategy Principle
- Calculate the 5-day RSI value of the stock
- Smooth the RSI values by taking 5-day simple moving average, obtaining the smoothed RSI indicator
- Set overbought line at 80 and oversold line at 40
- Generate buy signal when smoothed RSI crosses above oversold line
- Generate sell signal when smoothed RSI crosses below overbought line
The key of this strategy lies in the setting of smoothed RSI indicator. The RSI indicator can reflect the overbought/oversold status of stock prices. However, the original RSI indicator would fluctuate dramatically along with the price, which is not conducive to generating trading signals. Therefore, this strategy smooths it by taking 5-day simple moving average, which can effectively filter out some noise and make trading signals more clear and reliable.
Advantage Analysis
- The smoothed RSI indicator enhances the stability of the original RSI indicator, making trading signals more reliable
- Adopting simple moving average to smooth the RSI indicator realizes parameter optimization, avoiding limitations caused by manual threshold setting
- Combining overbought/oversold areas can clearly judge market status and generate buy/sell signals
- The strategy is simple to implement, easy to understand and apply
Risk and Optimization Analysis
- The smoothed RSI indicator reduces the sensitivity of RSI indicator, which may lead to delayed buy/sell signals
- The setting of moving average length and overbought/oversold thresholds affects strategy performance, requiring parameter optimization
- Trading signals may have false positives and false negatives, requiring combo analysis with price trends, trading volumes etc.
- Relying solely on RSI indicator may lead to unstable strategy performance, consider incorporating other technical indicators or fundamental indicators
Optimization Directions
- Adjust moving average days and overbought/oversold thresholds for parameter optimization
- Incorporate other technical indicators like MACD, KD to form combined trading signals
- Add trading volume filter to avoid wrong signals when price changes dramatically but trading volume is inactive
- Combine analysis of stock fundamentals and industry prosperity to improve strategy stability
- Add stop loss mechanism to cut losses when trade loss reaches certain level, controlling risks
Conclusion
This strategy generates relatively clear buy/sell signals by calculating and smoothing RSI indicator and setting reasonable overbought/oversold zones. Compared with original RSI strategies, it has the advantage of more stable and reliable signals. But there is still room for improvement, investors can enhance the strategy by parameter optimization, incorporating other indicators etc, so that it can adapt to more complex market environments.
/*backtest
start: 2023-12-01 00:00:00
end: 2023-12-31 23:59:59
period: 1h
basePeriod: 15m
exchanges: [{"eid":"Futures_Binance","currency":"BTC_USDT"}]
*/

//@version=5
strategy("Smoothed RSI Strategy", overlay=true)

// Calculate the RSI
length = 5
rsiValue = ta.rsi(close, length)

// Smooth the RSI using a moving average
smoothedRsi = ta.sma(rsiValue, length)

// Define overbought and oversold thresholds
overbought = 80
oversold = 40

// Buy signal when RSI is in oversold zone
buyCondition = ta.crossover(smoothedRsi, oversold)

// Sell signal when RSI is in overbought zone
sellCondition = ta.crossunder(smoothedRsi, overbought)

// Plotting the smoothed RSI
// Plotting the smoothed RSI in a separate pane
plot(smoothedRsi, color=color.blue, title="Smoothed RSI", style=plot.style_line, linewidth=2)

//plot(smoothedRsi, color=color.blue, title="Smoothed RSI")
hline(overbought, "Overbought", color=color.red)
hline(oversold, "Oversold", color=color.green)

// Strategy logic for buying and selling
if (buyCondition)
    strategy.entry("Buy", strategy.long)
if (sellCondition)
    strategy.close("Buy")