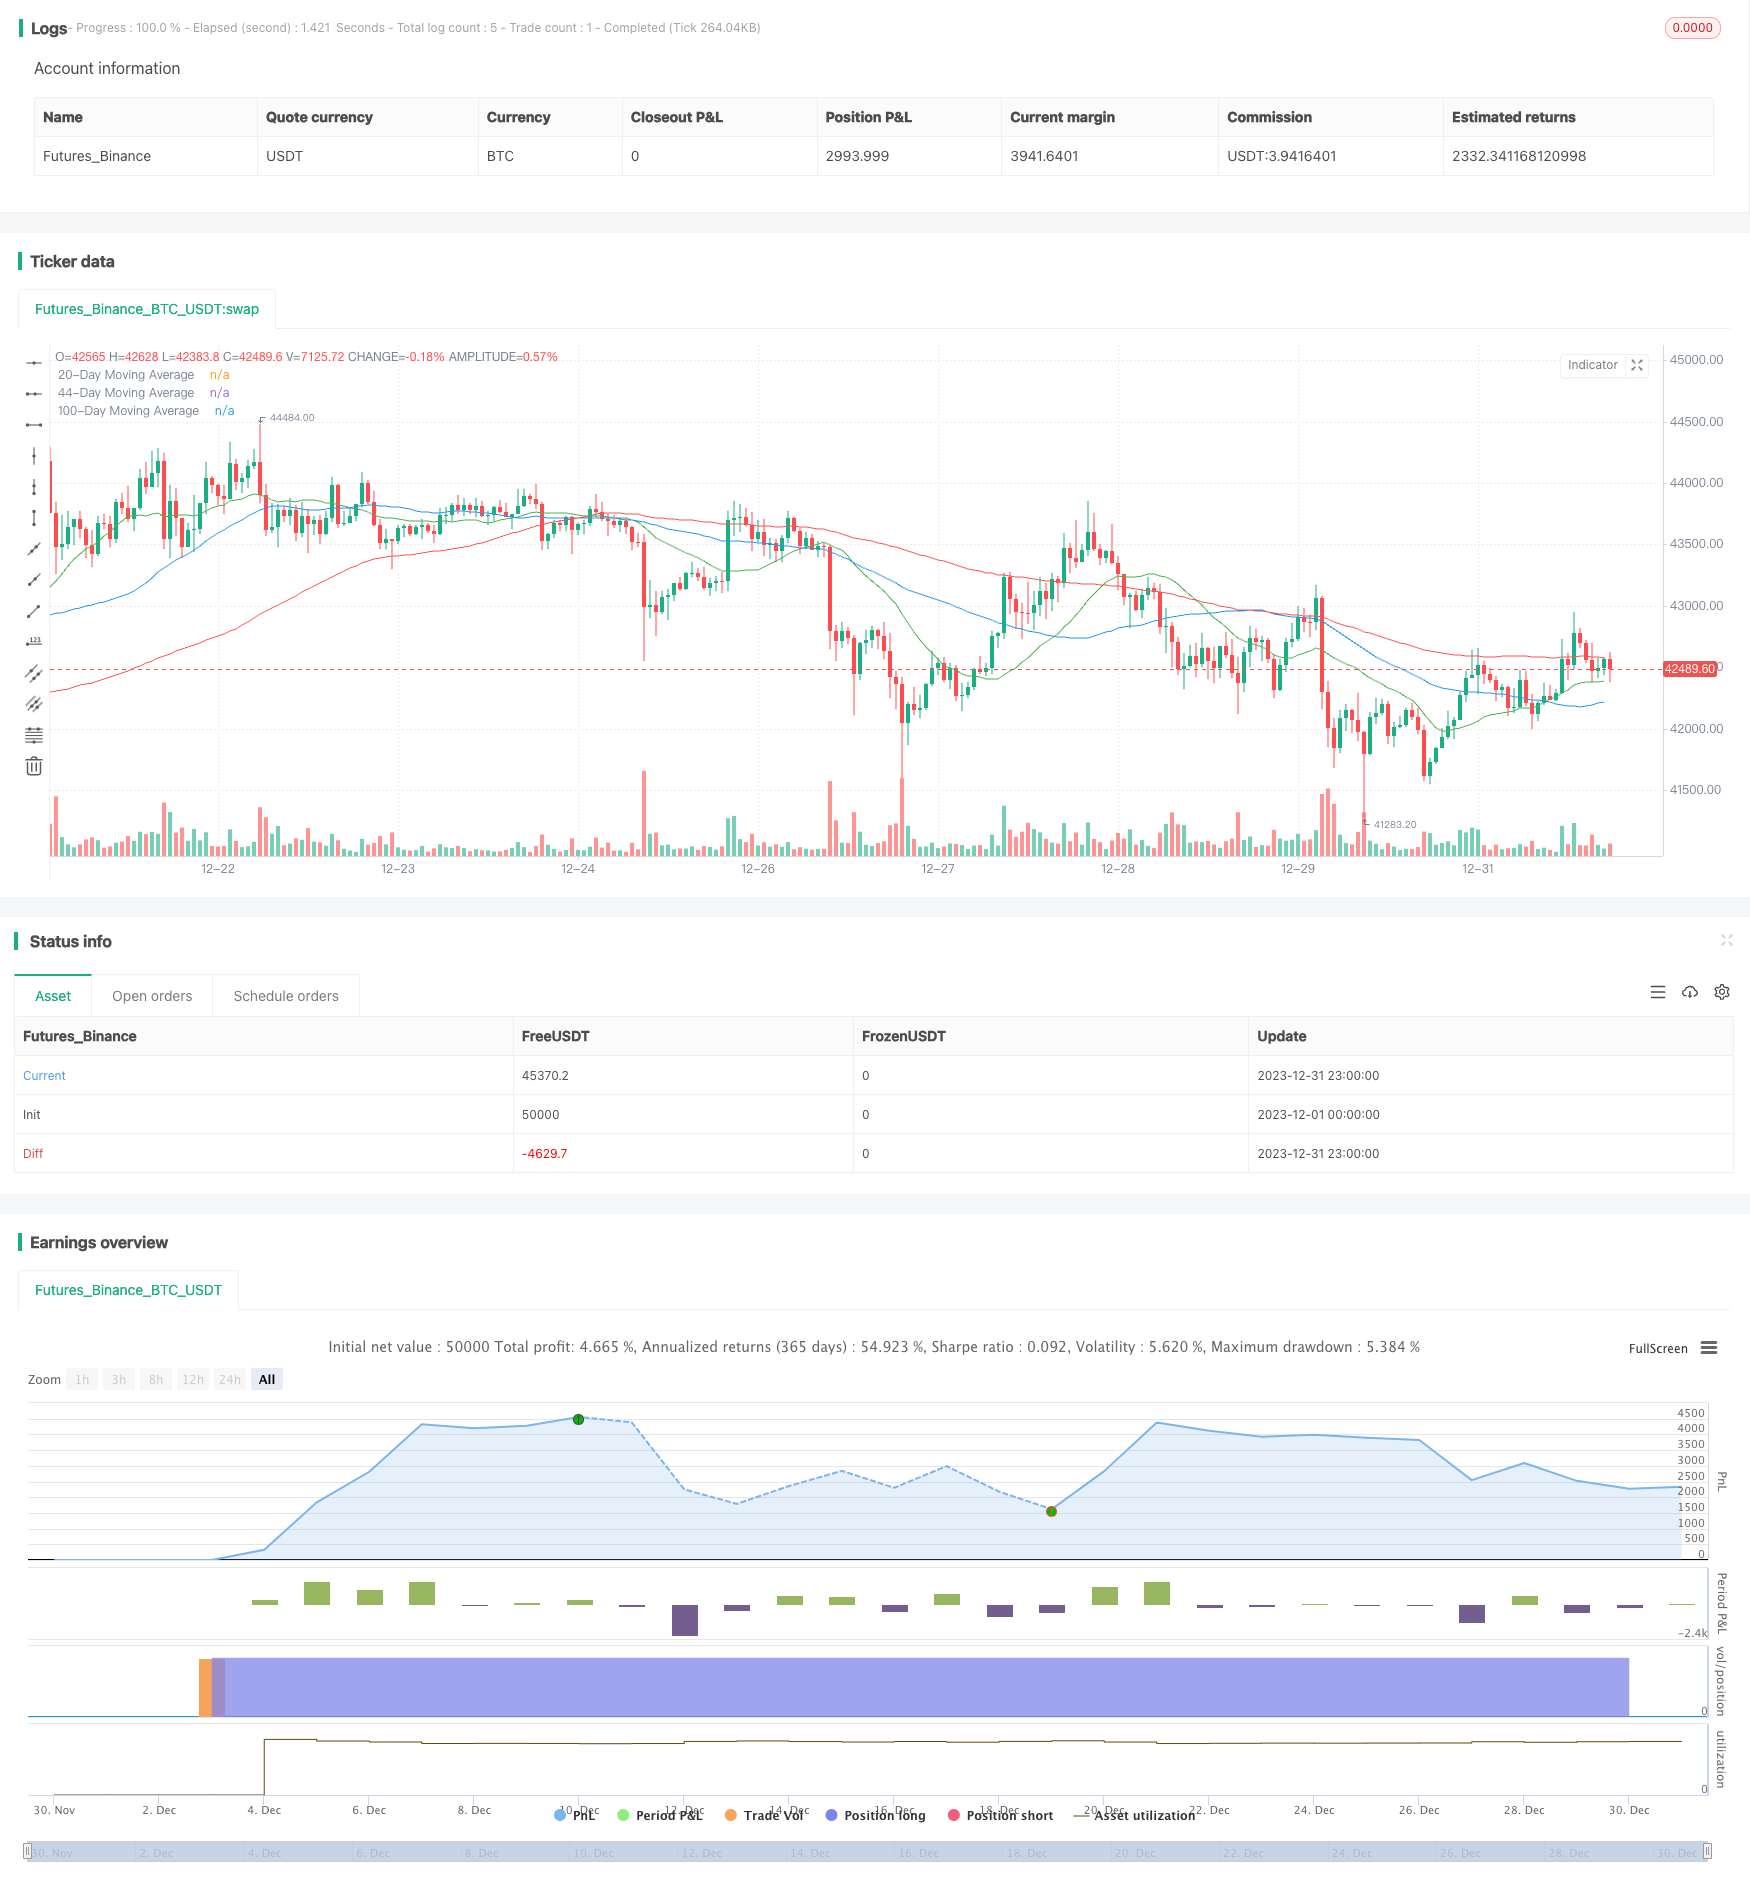
Overview
This strategy integrates the techniques of moving average crossover and resistance level breakout to set up buying and selling signals for automated trading. When the short-term moving average crosses over the medium-term moving average from below, and the stock price breaks through the resistance level, a buy signal is generated. The strategy sets take-profit at 15% price increase and stop-loss at 3% price decrease to control risks. This mature quantitative trading strategy can automatically identify market trends and get into positions when technical signals emerge, with proper risk management.
Strategy Principles
The strategy generates trading signals mainly based on the following technical indicators and judgements:
Moving average crossover technique: 20-day and 44-day simple moving averages are calculated. When the 20-day SMA crosses over the 44-day line, it is judged that the market is in an upward trend, generating a buy signal.
Resistance level breakout technique: Price levels that the stock price has repeatedly reached but failed to break through are called resistance levels. Breaking through them indicates the price is entering a new uptrend. This strategy regards a breakout above 0.7% of previous close as a resistance breakout.
RSI Oscillator: Relative Strength Index, a momentum indicator for identifying overbought and oversold conditions. This strategy uses the 14-day RSI value above 50 as an overbought signal.
Volume analysis: Volume exceeding past 10-day average often suggests stronger buying or selling interest and momentum in price movement.
Buy signals: Triggered when the short SMA crosses over medium SMA, with overbought RSI value and higher than average trading volume, indicating an upward trend.
Sell signals: 15% take-profit from entry price, 3% stop-loss.
This mature quantitative trading strategy integrates multiple technical analysis methods to identify market structure and trend, automatically generating trading signals during trend formations, with proper risk management.
Advantages of the Strategy
Captures market trends smoothly with moving average technique.
Avoids opening positions during false breakouts by incorporating volume analysis.
Effective risk control by setting stop-loss and take-profit, optimizing risk-reward ratio.
Overall excellent market structure judgement, rigorous trading rules and risk control make this a robust quantitative trading strategy.
Risks of the Strategy
Double moving average systems can be sensitive to parameter tuning for different periods.
Trend following systems cannot respond swiftly to sudden fundamental events, facing stop loss risks.
Although with stop loss set up, high trading frequency leads to unavoidable number of stop loss executions, resulting in uneven profit levels.
Signals from technical indicators often lag behind the best reversal points of the markets.
Optimization Directions
Optimize parameters like moving average lengths, stop loss/profit target by parameter tuning methods to find optimum.
Add other technical indicators like Bollinger Bands for range detection, MACD for spotting divergences etc. to improve signal accuracy.
Incorporate fundamental and event driven signals to avoid stop loss triggered by negative news.
Optimize money management by fixed quantity, fixed percentage methods to control per trade risks.
Conclusion
This strategy demonstrates smooth operations, accurate judgements and rigorous trading rules, representing one of the more effective quantitative trading techniques. But technical analysis alone has limitations in reading markets, so further improvements lie in incorporating more indicators and fundamental/event signals, optimizing stop loss/profit taking levels and money management mechanisms. In summary, this strategy has reached high level among technical analysis strategies, but should head towards fundamental/event driven cycles trading strategies in next evolution steps.
/*backtest
start: 2023-12-01 00:00:00
end: 2023-12-31 23:59:59
period: 1h
basePeriod: 15m
exchanges: [{"eid":"Futures_Binance","currency":"BTC_USDT"}]
*/

//@version=5
strategy("Advanced Strategy with Conditional Stop Loss", overlay=true)

// Parameters
ma_length_20 = 20
ma_length_44 = 44
ma_length_100 = 100
rsi_length = 14
volume_length = 10
profit_target = 1.15 // 15% above the buy price
stop_loss_target = 0.97 // 3% below the buy price
wait_candles = 10 // Number of candles to wait after selling, unless MA cross condition met

// Indicators
moving_average_20 = ta.sma(close, ma_length_20)
moving_average_44 = ta.sma(close, ma_length_44)
moving_average_100 = ta.sma(close, ma_length_100)
rsi = ta.rsi(close, rsi_length)
volumeAvg = ta.sma(volume, volume_length)

// Variables to manage the wait period after a sell
var int last_sell_candle = 0

// Update last sell candle
if (strategy.position_size[1] > 0 and strategy.position_size == 0)
    last_sell_candle := bar_index

// Trend identification
uptrend = close > moving_average_20
above_ma20_by_1_percent = close > moving_average_20 * 1.01
ma_cross = ta.crossover(moving_average_20, moving_average_44) or ta.crossunder(moving_average_20, moving_average_44)
close_near_high = (close >= high * 0.993) and (close <= high)

// Buy condition (only in uptrend, above 1% from 20-day MA, and respecting new filter)
can_buy_after_cross = ma_cross and close > high[1]
can_buy_after_wait = (bar_index - last_sell_candle) > wait_candles
buy_condition = (can_buy_after_cross or can_buy_after_wait) and uptrend and above_ma20_by_1_percent and close > moving_average_44 and close > moving_average_100 and close > high[1] and rsi > 50 and volume > volumeAvg and not close_near_high

// Entry
if (buy_condition and strategy.position_size == 0)
    strategy.entry("Buy", strategy.long)

// Exit conditions
if (strategy.position_size > 0)
    // Profit target
    profit_level = strategy.position_avg_price * profit_target
    strategy.exit("Take Profit", "Buy", limit=profit_level)

    // Dynamic Stop Loss - Check on every bar if the price has dropped 3% below the buy price
    stop_loss_level = strategy.position_avg_price * stop_loss_target
    if (low < stop_loss_level)
        strategy.close("Buy", comment="Stop Loss")

// Plotting
plot(moving_average_20, color=color.green, title="20-Day Moving Average")
plot(moving_average_44, color=color.blue, title="44-Day Moving Average")
plot(moving_average_100, color=color.red, title="100-Day Moving Average")