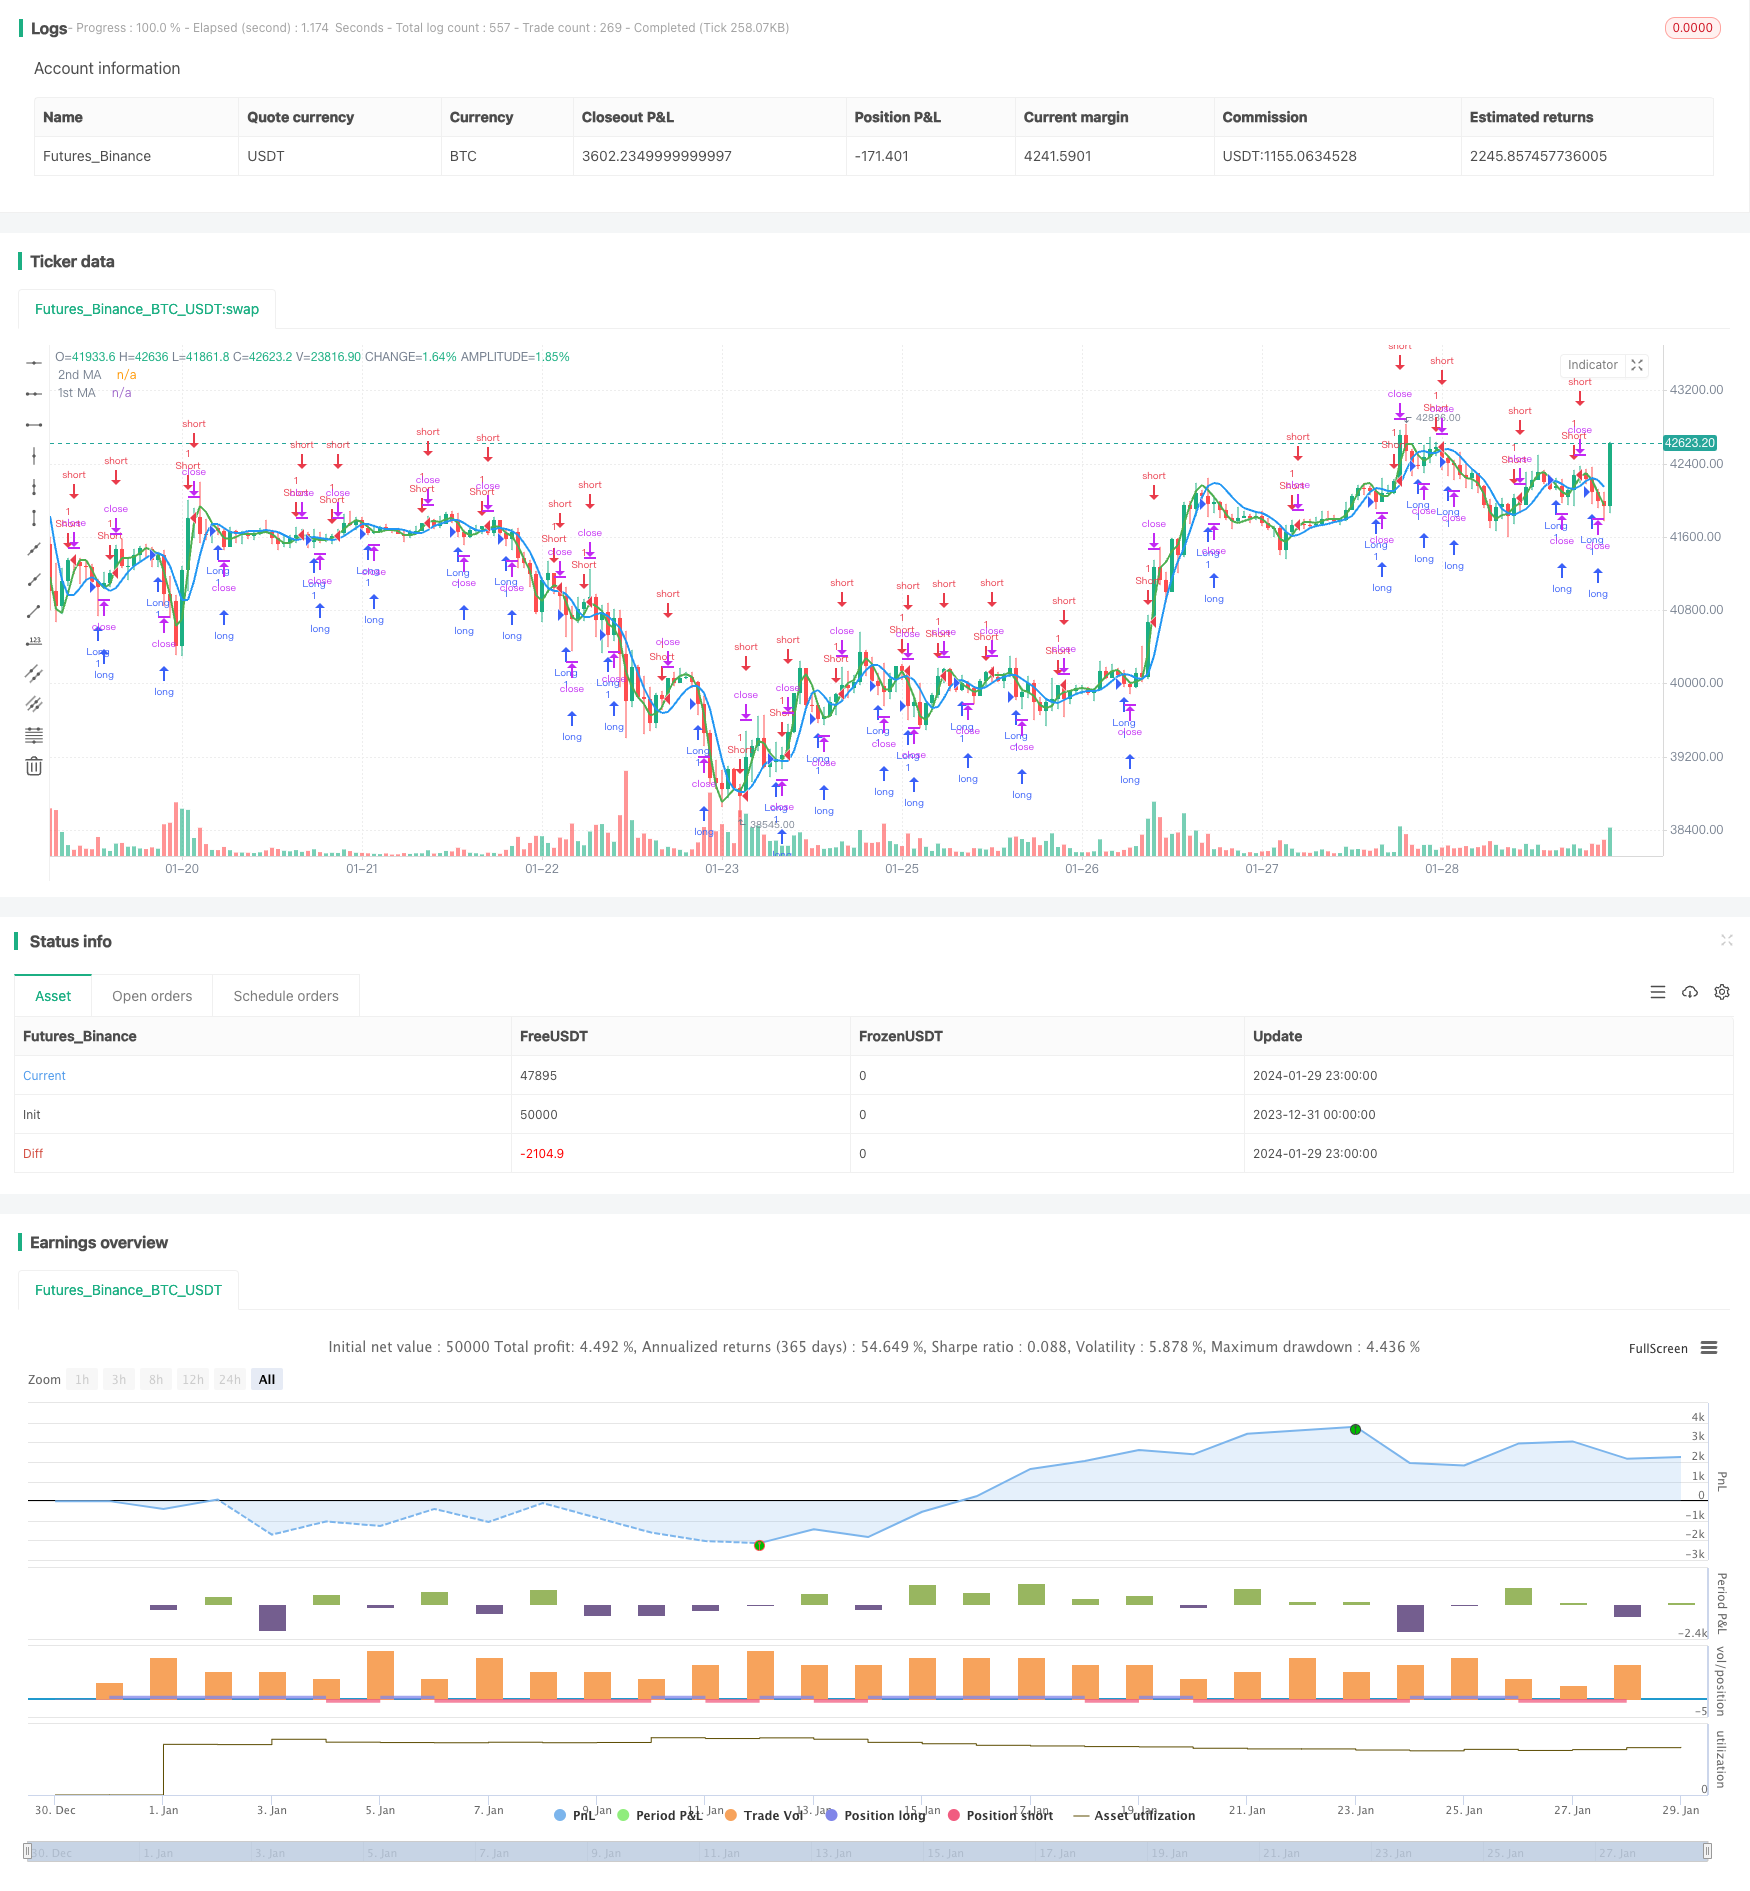
Overview
This strategy generates trading signals by calculating different types of moving averages (Simple Moving Average SMA, Exponential Moving Average EMA, Hull Moving Average HMA and Weighted Moving Average VWMA) and detecting crossover points between them, to determine the market trend and follow it. It generates buy signals when the shorter-term MA crosses above the longer-term MA from below, and sell signals when the opposite crossing happens.
Strategy Logic
The core idea of this strategy is to judge the market trend by comparing two moving averages. Specifically, it allows configuring two MAs with different types and lengths through input parameters. The first MA has a longer period to represent the major trend, while the second MA has a shorter period for the current short-term trend.
When the short-term MA crosses over the long-term MA from below, it signals that the short-term trend is strengthening and the market is entering an upward trend. Thus a buy signal is generated at this crossover point. Conversely, when the short-term MA crosses below the long-term MA, it suggests the short-term trend is weakening and the market is reversing downwards. Accordingly a sell signal is generated then.
By detecting such MA crossovers, this strategy follows the market trend to trade.
Advantages
- Utilizes classic and practical MA crossover method to determine major trends
- Supports combinations of various MA types, providing flexibility
- Simple and clear logic, easy to understand and automate
- Configurable parameters adapt to different market conditions
Risk Analysis
- MAs have lagging effect, signals may come at or near turning points when price action has already happened
- Trend judgements may be inaccurate, incurring unnecessary losses
- Results vary significantly with different MA parameter settings
Solutions:
- Use shorter MA periods for better sensitivity
- Add other filters for cross-verification to avoid mistakes
- Parameter optimization methods e.g. brute force, machine learning, genetic algorithms
- Control position sizing and stop loss properly
Improvement Directions
- Add other indicators as filters to enhance accuracy
- Auto-adapt MA parameters based on changing market conditions
- Utilize machine learning for automated parameter optimization
- Refine stop loss strategy
Conclusion
This strategy builds on the classic idea of using MA crossovers for major trend detection. With flexible MA combinations, it is simple to implement and suitable for algorithmic trading automation. Overall it is reasonably practical but leaves room for enhancements like parameter tuning, additional filters etc. to further improve performance.
/*backtest
start: 2023-12-31 00:00:00
end: 2024-01-30 00:00:00
period: 1h
basePeriod: 15m
exchanges: [{"eid":"Futures_Binance","currency":"BTC_USDT"}]
*/

//@version=3
//study(title="MA Crossover Strategy", overlay = true)
strategy("MA Crossover Strategy", overlay=true)
src = input(close, title="Source")

price = request.security(syminfo.tickerid, timeframe.period, src)
ma1 = input(25, title="1st MA Length")
type1 = input("HMA", "1st MA Type", options=["SMA", "EMA", "HMA", "VWMA"])

ma2 = input(7, title="2nd MA Length")
type2 = input("HMA", "2nd MA Type", options=["SMA", "EMA", "HMA", "VWMA"])

f_hma(_src, _length)=>
    _return = wma((2*wma(_src, _length/2))-wma(_src, _length), round(sqrt(_length)))

price1 = if (type1 == "SMA")
    sma(price, ma1)
else
    if (type1 == "EMA")
        ema(price, ma1)
    else
        if (type1 == "VWMA")
            vwma(price, ma1)
        else
            f_hma(price, ma1)

price2 = if (type2 == "SMA")
    sma(price, ma2)
else
    if (type2 == "EMA")
        ema(price, ma2)
    else
        if (type2 == "VWMA")
            vwma(price, ma2)
        else
            f_hma(price, ma2)


//plot(series=price, style=line,  title="Price", color=black, linewidth=1, transp=0)
plot(series=price1, style=line,  title="1st MA", color=blue, linewidth=2, transp=0)
plot(series=price2, style=line, title="2nd MA", color=green, linewidth=2, transp=0)


longCondition = crossover(price1, price2)
if (longCondition)
    strategy.entry("Long", strategy.long)

shortCondition = crossunder(price1, price2)
if (shortCondition)
    strategy.entry("Short", strategy.short)