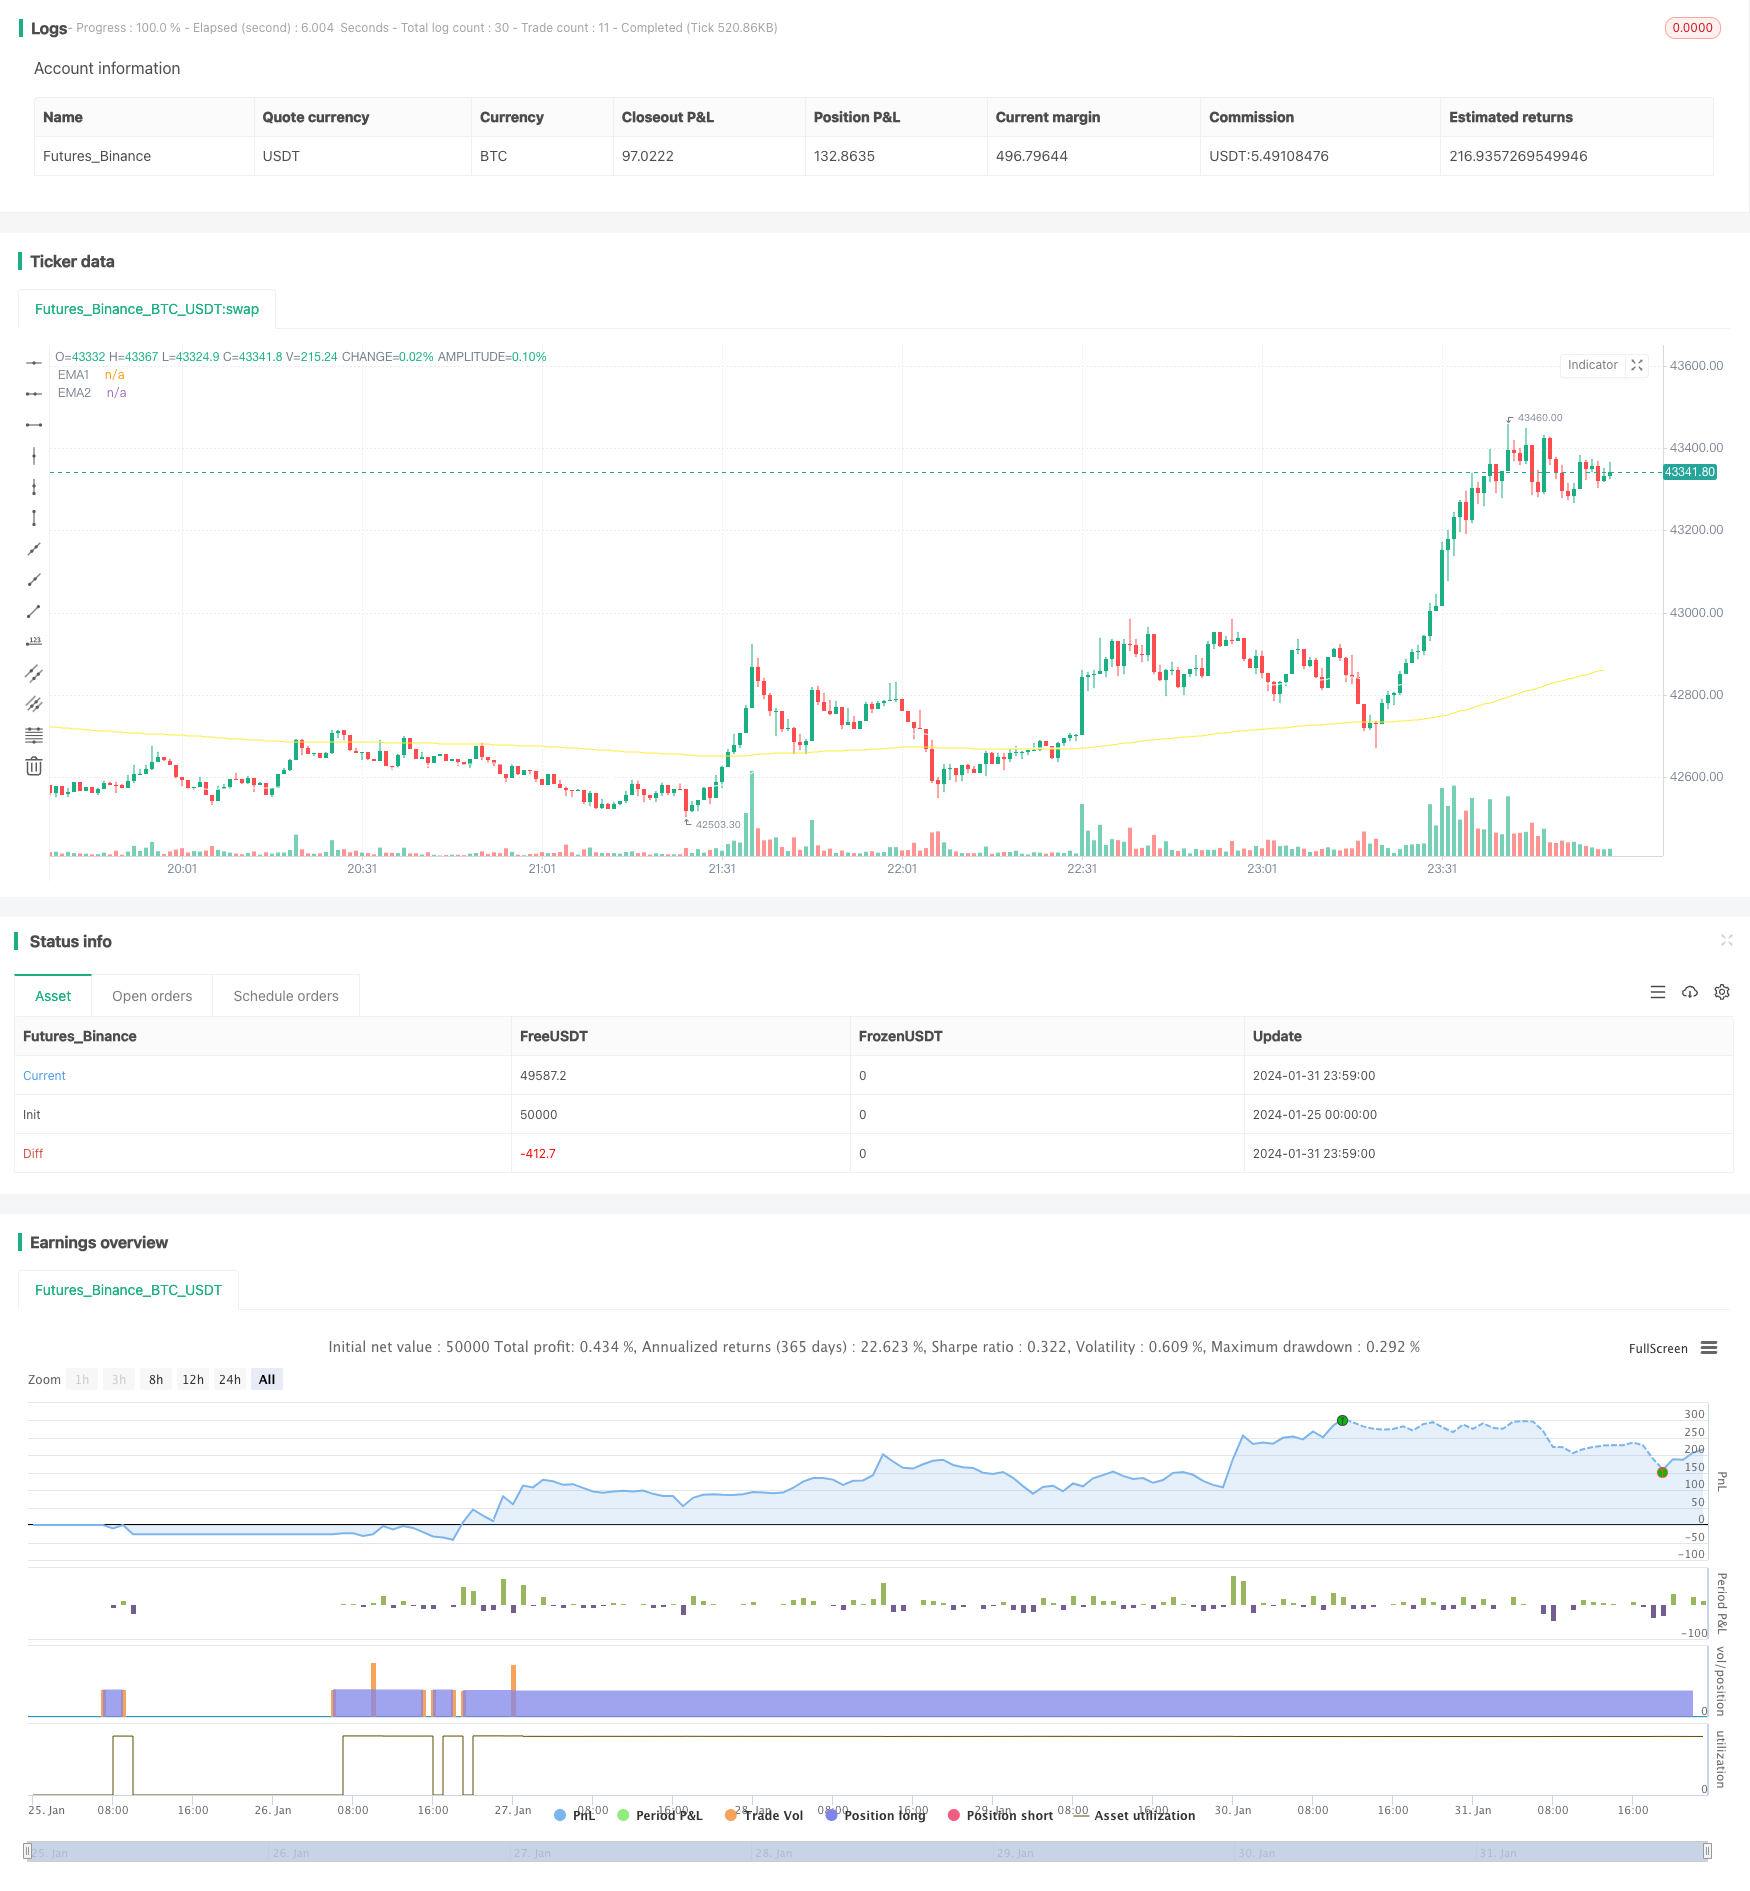
Overview
This strategy opens long positions based on the EMA crossover and RSI hidden bullish divergence signals to identify the beginning of an upward trend. The combination of EMA lines, RSI indicator, and K-line closing prices provides double confirmation for ensuring an upward momentum. This strategy is suitable to follow mid-long term trends and open long positions after price consolidations.
Strategy Logic
EMA Strategy: Using the golden cross of 50-period EMA and 250-period EMA to determine the trend direction. A close above the 50 EMA gives a long signal.
RSI Hidden Divergence Strategy: The RSI forms lower lows while price forms higher lows, signaling a trend reversal at the beginning. Limiting the number of pivot points filters out false signals.
K-line Closing Strategy: Go long when the closing price is above the 50 EMA line.
The combination of the above three strategies identifies the start of an upward trend and opens long positions accordingly.
Advantage Analysis
Using EMA lines to determine trend direction along with RSI reversal signals allows early entry at the beginning of trends.
The dual confirmation from EMA lines, RSI indicator, and K-line closing prices effectively filters out false signals.
Following mid-long term trends makes it suitable to identify new up trends after consolidations.
Risk Analysis
Close positions when the EMA lines have a death cross.
Identifying RSI hidden divergences needs experience, improper parameter tuning could lead to missing or false signals.
Parameters need optimization for different trading instruments.
Optimization Directions
Dynamically adjust EMA parameters for better trend determination accuracy.
Fine tune RSI parameters for better hidden divergence signal accuracy.
Add stop loss mechanisms like ATR or percentage stops to control risks.
Develop strategies for short positions to trade downward trends.
Conclusion
This strategy combines EMA lines for trend determination and RSI signals for increase accuracy. It identifies new upward trends after consolidations. With proper parameter tuning and risk management, it could achieve good results. Compared to simple moving average strategies, it has higher accuracy in catching trends with better win rates. Overall it is a practical trend following strategy.
/*backtest
start: 2024-01-25 00:00:00
end: 2024-02-01 00:00:00
period: 1m
basePeriod: 1m
exchanges: [{"eid":"Futures_Binance","currency":"BTC_USDT"}]
*/

//@version=4

strategy(title="EMA RSI ATR Hidden Div Strat", shorttitle="Hidden Div Strat", overlay = true, pyramiding = 0, max_bars_back=3000, calc_on_order_fills = false, commission_type =  strategy.commission.percent, commission_value = 0, default_qty_type = strategy.percent_of_equity, default_qty_value = 10, initial_capital=5000, currency=currency.USD)

// Time Range
FromMonth=input(defval=1,title="FromMonth",minval=1,maxval=12)
FromDay=input(defval=1,title="FromDay",minval=1,maxval=31)
FromYear=input(defval=2020,title="FromYear",minval=2016)
ToMonth=input(defval=1,title="ToMonth",minval=1,maxval=12)
ToDay=input(defval=1,title="ToDay",minval=1,maxval=31)
ToYear=input(defval=9999,title="ToYear",minval=2017)
start=timestamp(FromYear,FromMonth,FromDay,00,00)
finish=timestamp(ToYear,ToMonth,ToDay,23,59)
window()=>true

// Bar's time happened on/after start date?
afterStartDate = time >= start and time<=finish?true:false

//EMA'S
emasrc = close

len1 = input(50, minval=1, title="EMA1")
ema1 = ema(emasrc, len1)
col1 = color.white

len2 = input(250, minval=1, title="EMA2")
ema2 = ema(emasrc, len2)
col2 = color.yellow

//Plots
plot(ema1, title="EMA1", linewidth=1, color=col1)
plot(ema2, title="EMA2", linewidth=1, color=col2)

//Stoch
periodK = input(4, title="K", minval=1)
periodD = input(4, title="D", minval=1)
smoothK = input(3, title="Smooth", minval=1)
k = sma(stoch(close, high, low, periodK), smoothK)
d = sma(k, periodD)

//Hidden Divergence Indikator

len = input(title="RSI Period", minval=1, defval=14)
src = input(title="RSI Source", defval=close)
lbR = input(title="Pivot Lookback Right", defval=1)
lbL = input(title="Pivot Lookback Left", defval=19)
rangeUpper = input(title="Max of Lookback Range", defval=20)
rangeLower = input(title="Min of Lookback Range", defval=4)
hiddenBullColor = color.new(color.green, 80)
textColor = color.white
noneColor = color.new(color.white, 100)
osc = rsi(src, len)

plFound = na(pivotlow(osc, lbL, lbR)) ? false : true
phFound = na(pivothigh(osc, lbL, lbR)) ? false : true
_inRange(cond) =>
	bars = barssince(cond == true)
	rangeLower <= bars and bars <= rangeUpper

//------------------------------------------------------------------------------
// Hidden Bullish
// Osc: Lower Low

oscLL = osc[lbR] < valuewhen(plFound, osc[lbR], 1) and _inRange(plFound[1])

// Price: Higher Low

priceHL = low[lbR] > valuewhen(plFound, low[lbR], 1)
hiddenBullCond = priceHL and oscLL and plFound

//buy Conditions
buyhiddenbull = hiddenBullCond[1] or hiddenBullCond[2] or hiddenBullCond[3] or hiddenBullCond[4] or hiddenBullCond[5] or hiddenBullCond[6] or hiddenBullCond[7] or hiddenBullCond[8] or hiddenBullCond[9] or hiddenBullCond[10]
emacondition = ema1 > ema2
upcondition = close[1] > ema1[1] and ema2[1] and close[2] > ema1[2] and ema2[2] and close[3] > ema1[3] and ema2[3]
crossup = k[0] >= d[0] and k[1] <= d[1]
longcondition = emacondition and upcondition and crossup and buyhiddenbull

if (afterStartDate)
    strategy.entry("Long", strategy.long, when = longcondition)

//TakeProfit, StopLoss lowest low
profitfactor = input(title="Profitfactor", type=input.float, step=0.1, defval=1.6)
loLen = input(title="Lowest Low Lookback", type=input.integer,
  defval=38, minval=2)
stop_level = lowest(low, loLen)[1]
bought = strategy.position_size[1] < strategy.position_size
barsbought = barssince(bought)

if strategy.position_size>0
    profit_level = strategy.position_avg_price + ((strategy.position_avg_price - stop_level[barsbought])*profitfactor)
    strategy.exit(id="TP/ SL", stop=stop_level[barsbought], limit=profit_level)