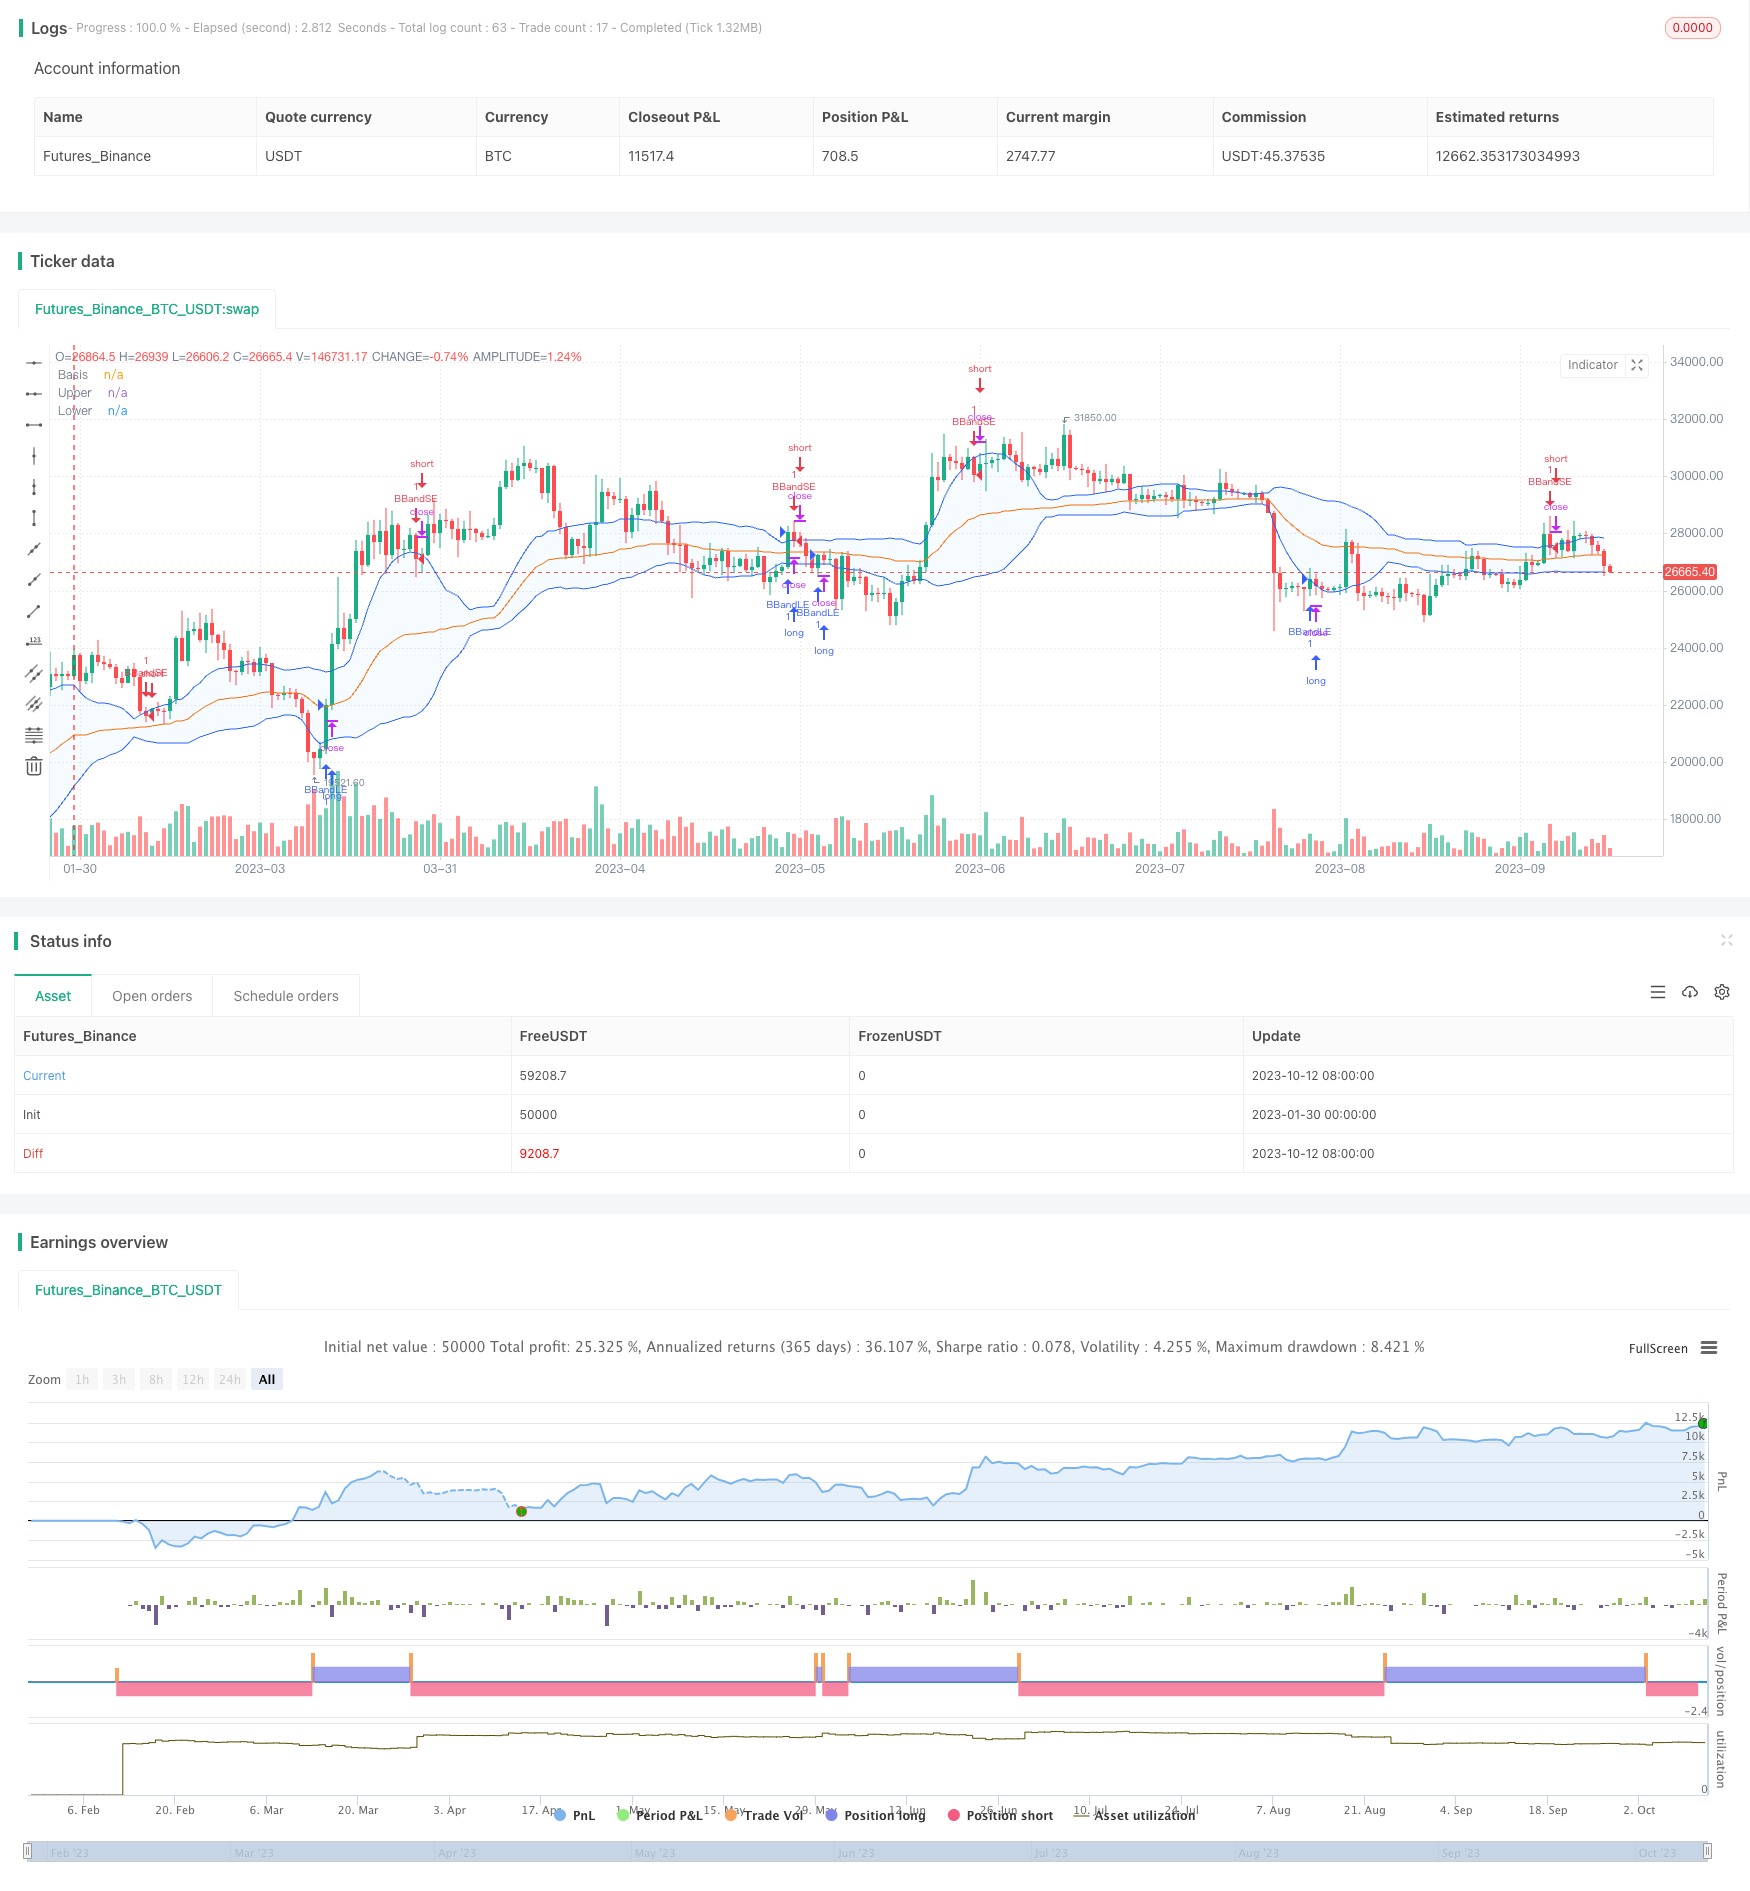
Overview
This strategy constructs Bollinger Bands with different types of moving averages as input to discover more trading opportunities. It provides 12 kinds of moving averages to choose from, allowing flexible combinations for optimum parameters.
Strategy Logic
The core of this strategy lies in using the moving average types selected by user input, including SMA, EMA, WMA, DEMA, TMA, VAR, WWMA, ZLEMA, TSF, HULL, TILL etc, 12 in total, combined with Bollinger Bands to form trading signals. The middle band of the Bollinger Bands adopts the selected moving average, while the upper and lower bands are one positive/negative standard deviation away from middle band. Short when price breaks upper band, long when price breaks lower band. By combining different types of moving averages, parameters can be optimized for more steady and accurate trading signals.
The main components of the code are:
1. Calculation functions for 12 types of moving averages, including SMA, EMA, WMA etc.
2. The getMA function returns corresponding moving average based on mav input parameter.
3. Calculation of middle, upper and lower bands of Bollinger Bands. The middle band uses moving average from getMA function.
4. Plotting of Bollinger Bands.
5. Generation of long and short signals. Go long when price breaks below lower band, go short when price breaks above upper band.
Advantage Analysis
The biggest advantage of this strategy is providing multiple types of moving averages. Different market environments suit different moving averages in terms of reaction sensitivity. Adopting multiple moving average types greatly enhances the adaptability of the strategy. In addition, this strategy allows parameter optimization for the lengths of the moving averages, in order to find optimum combinations and hence obtain more accurate trading signals.
Risk Analysis
The main risk of this strategy lies in chaotic signals from the moving averages themselves, with possibilities of multiple false breakouts. Also, Bollinger Bands indicator is quite sensitive to wild price swings, making it hard for middle band to track price effectively. This calls for more stable types of moving averages to be used, together with proper parameter tuning.
Optimization Directions
The strategy can be optimized from the following aspects:
1. Test different combinations of moving averages to find optimum parameters for improving signal stability.
2. Add stop loss mechanisms to limit losses from occasional bad signals.
3. Incorporate other indicators for signal filtering, avoiding over-trading, e.g. MACD, KD etc.
4. Optimize money management, adjust position sizing.
Conclusion
The strategy is quite innovative overall, enriching Bollinger Bands indicator with more sophisticated applications. By adjusting the combined moving averages, more accurate and steady signals can be obtained. It also opens up new ideas for optimizing Bollinger Bands strategies. With parameter tuning and optimizations, this strategy can become a very practical trading tool.
/*backtest
start: 2023-01-30 00:00:00
end: 2023-10-13 00:00:00
period: 1d
basePeriod: 1h
exchanges: [{"eid":"Futures_Binance","currency":"BTC_USDT"}]
*/

//@version=4
strategy("Bollinger Bands Strategy (MA type)", overlay=true)
src = input(close, title="Source")
length = input(20,step=10, minval=1)
mult = input(1,type=input.float, minval=0.001, maxval=50, title="StdDev")

length1=input(26, "Long Moving Average Length", minval=1)
length2=input(9, "Trigger Length", minval=1)
T3a1 = input(0.7, "TILLSON T3 Volume Factor", step=0.1)
////////////
mav = input(title="Moving Average Type", defval="VAR", options=["SMA", "EMA", "WMA", "DEMA", "TMA", "VAR", "WWMA", "ZLEMA", "TSF", "HULL", "TILL"])
Var_Func(src,length)=>
    valpha=2/(length+1)
    vud1=src>src[1] ? src-src[1] : 0
    vdd1=src<src[1] ? src[1]-src : 0
    vUD=sum(vud1,9)
    vDD=sum(vdd1,9)
    vCMO=nz((vUD-vDD)/(vUD+vDD))
    VAR=0.0
    VAR:=nz(valpha*abs(vCMO)*src)+(1-valpha*abs(vCMO))*nz(VAR[1])
VAR=Var_Func(src,length)
DEMA = ( 2 * ema(src,length)) - (ema(ema(src,length),length) )
Wwma_Func(src,length)=>
    wwalpha = 1/ length
    WWMA = 0.0
    WWMA := wwalpha*src + (1-wwalpha)*nz(WWMA[1])
WWMA=Wwma_Func(src,length)
Zlema_Func(src,length)=>
    zxLag = length/2==round(length/2) ? length/2 : (length - 1) / 2
    zxEMAData = (src + (src - src[zxLag]))
    ZLEMA = ema(zxEMAData, length)
ZLEMA=Zlema_Func(src,length)
Tsf_Func(src,length)=>
    lrc = linreg(src, length, 0)
    lrc1 = linreg(src,length,1)
    lrs = (lrc-lrc1)
    TSF = linreg(src, length, 0)+lrs
TSF=Tsf_Func(src,length)
HMA = wma(2 * wma(src, length / 2) - wma(src, length), round(sqrt(length)))
T3e1=ema(src, length)
T3e2=ema(T3e1,length)
T3e3=ema(T3e2,length)
T3e4=ema(T3e3,length)
T3e5=ema(T3e4,length)
T3e6=ema(T3e5,length)
T3c1=-T3a1*T3a1*T3a1
T3c2=3*T3a1*T3a1+3*T3a1*T3a1*T3a1
T3c3=-6*T3a1*T3a1-3*T3a1-3*T3a1*T3a1*T3a1
T3c4=1+3*T3a1+T3a1*T3a1*T3a1+3*T3a1*T3a1
T3=T3c1*T3e6+T3c2*T3e5+T3c3*T3e4+T3c4*T3e3


getMA(src, length) =>
    ma = 0.0
    if mav == "SMA"
        ma := sma(src, length)
        ma

    if mav == "EMA"
        ma := ema(src, length)
        ma

    if mav == "WMA"
        ma := wma(src, length)
        ma

    if mav == "DEMA"
        ma := DEMA
        ma

    if mav == "TMA"
        ma := sma(sma(src, ceil(length / 2)), floor(length / 2) + 1)
        ma

    if mav == "VAR"
        ma := VAR
        ma

    if mav == "WWMA"
        ma := WWMA
        ma

    if mav == "ZLEMA"
        ma := ZLEMA
        ma

    if mav == "TSF"
        ma := TSF
        ma

    if mav == "HULL"
        ma := HMA
        ma

    if mav == "TILL"
        ma := T3
        ma
    ma

//////////
basis = getMA(src, length)
dev = mult * stdev(src, length)
upper = basis + dev
lower = basis - dev
offset = input(0, "Offset",minval = -500, maxval = 500)
plot(basis, "Basis",color=#FF6D00, offset = offset)
p1 = plot(upper, "Upper", color=#2962FF, offset = offset)
p2 = plot(lower, "Lower", color=#2962FF, offset = offset)
fill(p1, p2, title = "Background", color=color.rgb(33, 150, 243, 95))
/////////
buyEntry = crossover(src, lower)
sellEntry = crossunder(src, upper)
if (crossover(src, lower))
	strategy.entry("BBandLE", strategy.long, stop=lower, oca_name="BollingerBands",  comment="BBandLE")
else
	strategy.cancel(id="BBandLE")
if (crossunder(src, upper))
	strategy.entry("BBandSE", strategy.short, stop=upper, oca_name="BollingerBands",  comment="BBandSE")
else
	strategy.cancel(id="BBandSE")
//plot(strategy.equity, title="equity", color=color.red, linewidth=2, style=plot.style_areabr)