Momentum Average Inverse Relief Pullback Strategy
Author: ChaoZhang, Date: 2024-02-18 10:21:04Tags:

Overview
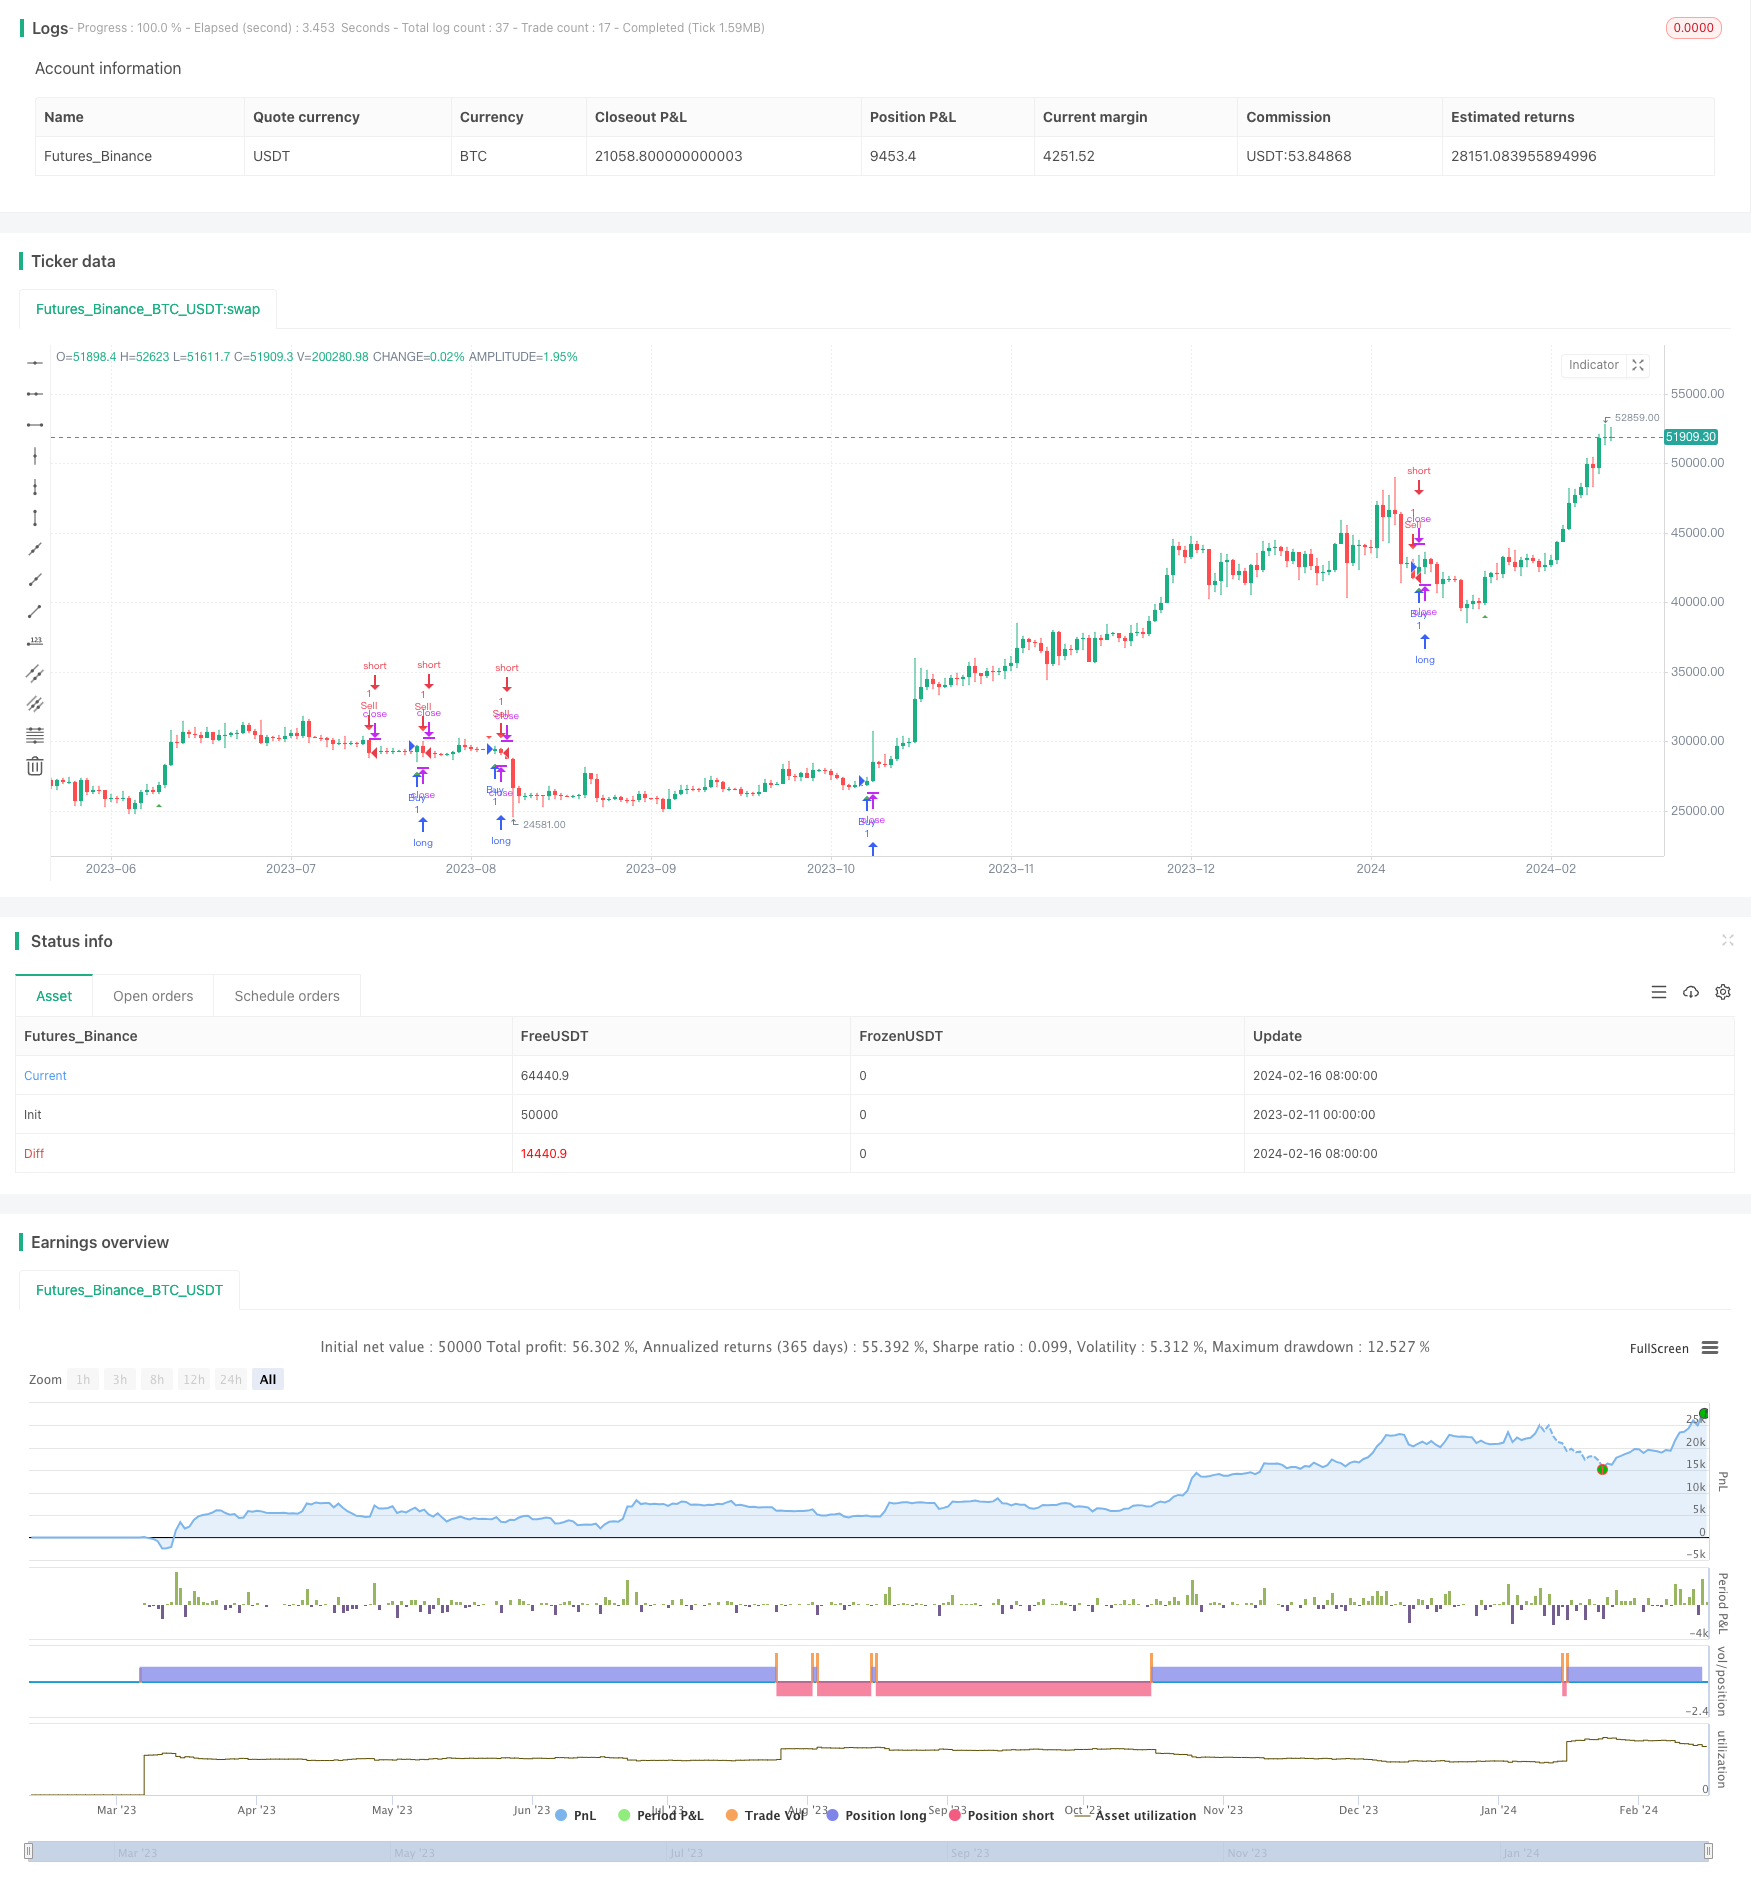
The Momentum Average Inverse Relief Pullback Strategy is a simple strategy to trade reversal around moving average lines. It uses 50-period Exponential Moving Average (EMA) as the main trend indicator, combined with candlestick engulfing patterns to identify reversal opportunities. After a penetration through the EMA, it waits for 2-3 candles in the opposite direction to form. If the next candle shows an engulfing reversal pattern, a reverse position will be taken at the candle close, with a 1-minute stop loss timer.
Principles
The key assumptions of this strategy are:
The 50-period EMA is effective in determining market trend. A close above it signals bull trend while a close below it signals bear trend.
After a trend penetration through the EMA, there are often short-term pullbacks. By identifying the end of pullbacks using reversal candlestick patterns, profitable reverse trades can be executed.
Specifically, the strategy first calculates the 50-period EMA, then checks if price breaks through it. If a bull breakout happens, it waits for 2-3 red candles downwards. If the next candle shows a bullish engulfing pattern, long position will be taken on close. Similarly for bear breakouts. After taking positions, a 1-minute stop loss timer is started. Positions will be closed on timer expiration.
Advantages
The main advantages of this strategy:
The logic is simple and clear, easy to understand and implement, suitable for beginners.
It utilizes both the trending effectiveness of moving averages and the predictive power of candlestick patterns, making the signals more reliable.
The stop loss timer controls single trade risk.
The systematic rules avoid subjective judgements and improve consistency.
Risks
Some main risks are:
The 50-period EMA cannot fully capture trends accurately all the time. There can be misjudgements of trend.
Candlestick patterns also have probabilistic nature which leads to false signals.
Ineffective stop loss timer settings may lead to larger losses or profit giving up.
Slippage, partial fills etc. impacts strategy performance.
Some mitigations:
Optimize EMA period parameter to find the best fit.
Incorporate other indicators for strengthening signals.
Test and find optimal risk parameters.
Implement stop loss mechanisms against slippage in live trading.
Enhancement Opportunities
Some ways to enhance the strategy:
Optimize EMA parameter to find best periods.
Test other EMA variants e.g. weighted moving average.
Add filters on volume or volatility to remove false signals during sideways periods.
Create combination strategies with other indicators e.g. Stochastics, MACD to improve signal quality.
Fine tune the stop loss timer duration based on product specification and trading sessions.
Consider adding profit taking mechanisms to lock gains after reaching profit targets.
Conclusion
The Momentum Average Inverse Relief Pullback Strategy is a simple and practical short term trading strategy. It uses EMA crossovers to determine trends and candlestick patterns to identify reversals for executing tactical trades. Despite some parameter optimization space, its clarity in logic makes it a good starting point strategy for novice quants. With proper testing and refinements, it can evolve into a robust tactical system.
/*backtest
start: 2023-02-11 00:00:00
end: 2024-02-17 00:00:00
period: 1d
basePeriod: 1h
exchanges: [{"eid":"Futures_Binance","currency":"BTC_USDT"}]
*/

//@version=5
strategy("LinoR EMA Pullback Strategy", shorttitle="EPS", overlay=true)

// Define EMA period
emaPeriod = input(50, title="EMA Period")

// Calculate 50 EMA
ema50 = ta.ema(close, emaPeriod)

// Calculate engulfing conditions
engulfingBullish = close[1] < open[1] and close > open and close > close[1] and open < open[1]
engulfingBearish = close[1] > open[1] and open > close and open > open[1] and close < close[1]

// Define a 1-minute timer
var timer = 0
if bar_index > 0
    timer := timer[1] + 1

// Long condition
longCondition = ta.crossover(close, ema50) and engulfingBullish
if longCondition
    strategy.entry("Buy", strategy.long)

// Short condition
shortCondition = ta.crossunder(close, ema50) and engulfingBearish
if shortCondition
    strategy.entry("Sell", strategy.short)

// Exit after 1 minute
if timer >= 1
    strategy.close("Exit")

plotshape(series=longCondition, title="Long Signal", location=location.belowbar, color=color.green, style=shape.triangleup, size=size.small)
plotshape(series=shortCondition, title="Short Signal", location=location.abovebar, color=color.red, style=shape.triangledown, size=size.small)
- Dual Moving Average Trading Strategy
- Dual Moving Average Golden Cross Trend Trading Strategy
- V-Reversal SMA Strategy
- Linear Regression Channel Breakout Trading Strategy
- Dual-EMA Indicator Based Trend Following Strategy
- Real Turtle—Steadfast as a Rock Turtle Strategy
- Open-High-Low Stop Loss Tracking Strategy
- Comprehensive Futures Automated Trading Strategy for Both Long and Short
- Supertrend Breakout Trading Strategy
- 3 Moving Average Swing Interval Reversal Strategy
- Multitimeframe Trend Hunter Strategy
- DCCI Breakout Strategy
- Doubly Confident Price Oscillation Quant Strategy
- Volatility Trend Tracking Strategy
- Dual-driver Quantized Reversal Tracking Strategy
- Overlay Trend Signals Strategy
- Swing Points Breakouts Long-term strategy
- The Quantitative Trading Strategy Based on Dynamic Moving Average Breakthrough Entry
- Three Candle Reversal Trend Strategy
- Adaptive Dual Breakthrough Trading Strategy