Overview
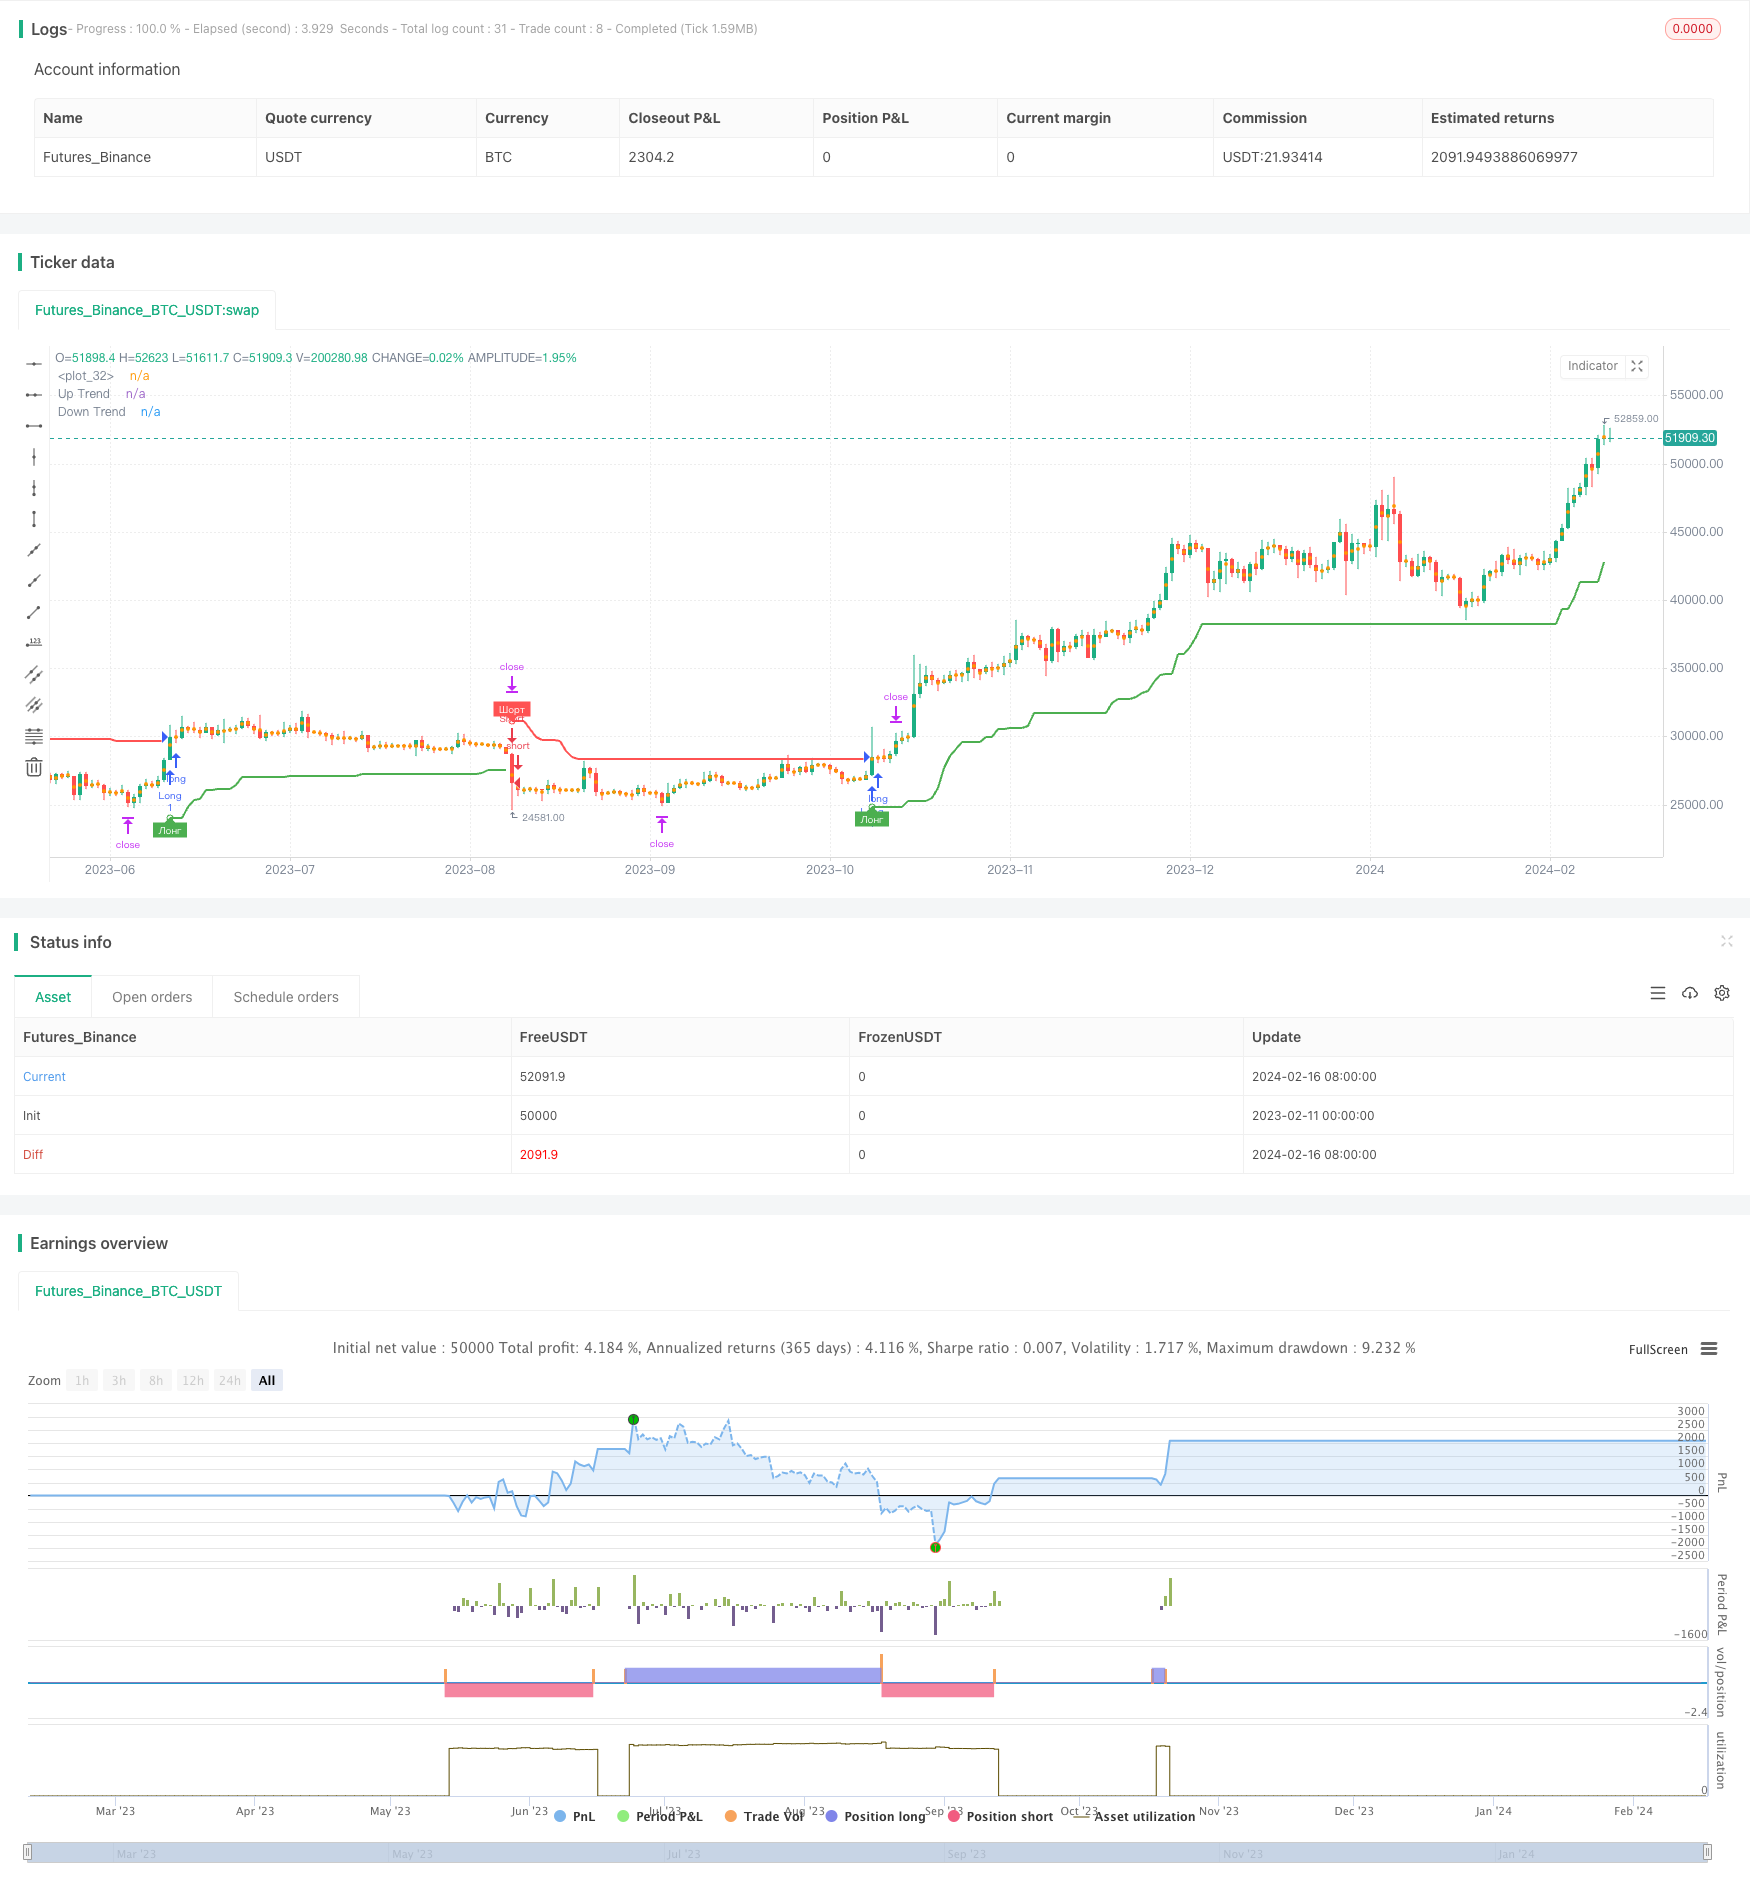
This strategy is developed based on the Supertrend indicator. It combines price action and the direction of the Supertrend channel to judge market trends and generate trading signals when the channel direction changes.
When the price breaks through the Supertrend channel, go long; when the price breaks below the lower channel of Supertrend, go short. At the same time, it has a trend tracking stop loss mechanism.
Strategy Logic
The Supertrend channel consists of an upper rail and a lower rail. The area inside the channel is the consolidation area and the area outside is the trending area. It uses the average true range multiplied by a factor to determine the width of the channel.
When the price breaks through the upper rail from the bottom, it is a buy signal. This means that a new uptrend is starting. When the price breaks through the lower rail from the top, it is a sell signal. This means that a new downtrend is beginning.
The strategy uses the Supertrend indicator to judge the main trend direction. When the channel direction changes, that is when the price breaks through the channel rails, trading signals are generated. Then use a trend tracking stop loss to lock in profits.
Advantage Analysis
This is a relatively simple and intuitive breakout strategy. It has the following advantages:
Use Supertrend channels to determine the main trend direction and avoid noise trading.
Go with the trend, judge long and short opportunities based on the price’s relationship with the channel.
It has a clear stop loss mechanism to effectively control risks.
The stop loss method is trend tracking stop loss, which can maximize profit locking.
Risks and Improvements
There are also some risks to this strategy, mainly including:
Improper parameter settings of the Supertrend may lead to false signals.
Breakout signals may be short-term reversal signals, resulting in losses.
The stop loss method is only trend tracking stop loss, which may stop loss prematurely.
The corresponding improvement measures include:
Test data from different markets and optimize parameters.
Filter signals in combination with other indicators.
Judge the reliability of breakout signals combined with price structure.
Increase background stop loss to further control risks.
Summary
In general, this strategy is a relatively simple and intuitive trend following strategy. It uses Supertrend channels to clearly determine the trend direction and generates signals when the channel changes direction. Then use trend tracking stop loss to lock in profits.
Compared with other indicators, the Supertrend channel has better tolerance for price fluctuations. But there is still room for profit for this strategy. It can be optimized in terms of signal filtering and stop loss methods to further improve stability.
/*backtest
start: 2023-02-11 00:00:00
end: 2024-02-17 00:00:00
period: 1d
basePeriod: 1h
exchanges: [{"eid":"Futures_Binance","currency":"BTC_USDT"}]
*/

//@version=4
strategy("Supertrend TEST Strategy", overlay = true, format=format.price, precision=2)

Periods = input(title="ATR Period", type=input.integer, defval=4)
src = input(hlc3, title="Source")
Multiplier = input(title="ATR Multiplier", type=input.float, step=0.1, defval=4.7)
changeATR= input(title="Change ATR Calculation Method ?", type=input.bool, defval=true)
showsignals = input(title="Show Buy/Sell Signals ?", type=input.bool, defval=true)
highlighting = input(title="Highlighter On/Off ?", type=input.bool, defval=true)
tp=close
sl=close

atr2 = sma(tr, Periods)
atr= changeATR ? atr(Periods) : atr2
up=src-(Multiplier*atr)
up1 = nz(up[1],up)
up := close[1] > up1 ? max(up,up1) : up
dn=src+(Multiplier*atr)
dn1 = nz(dn[1], dn)
dn := close[1] < dn1 ? min(dn, dn1) : dn
trend = 1
trend := nz(trend[1], trend)
trend := trend == -1 and close > dn1 ? 1 : trend == 1 and close < up1 ? -1 : trend
upPlot = plot(trend == 1 ? up : na, title="Up Trend", style=plot.style_linebr, linewidth=2, color=color.green)
buySignal = trend == 1 and trend[1] == -1
plotshape(buySignal ? up : na, title="UpTrend Begins", location=location.absolute, style=shape.circle, size=size.tiny, color=color.green )
plotshape(buySignal and showsignals ? up : na, title="Лонг", text="Лонг", location=location.absolute, style=shape.labelup, size=size.tiny, color=color.green, textcolor=color.white )
dnPlot = plot(trend == 1 ? na : dn, title="Down Trend", style=plot.style_linebr, linewidth=2, color=color.red)
sellSignal = trend == -1 and trend[1] == 1
plotshape(sellSignal ? dn : na, title="DownTrend Begins", location=location.absolute, style=shape.circle, size=size.tiny, color=color.red )
plotshape(sellSignal and showsignals ? dn : na, title="Шорт", text="Шорт", location=location.absolute, style=shape.labeldown, size=size.tiny, color=color.red, textcolor=color.white )
mPlot = plot(ohlc4, title="", style=plot.style_circles, linewidth=0)
longFillColor = highlighting ? (trend == 1 ? color.green : color.white) : color.white
shortFillColor = highlighting ? (trend == -1 ? color.red : color.white) : color.white


if (strategy.position_size > 0)
	tp:=tp[1]
	sl:=up
	strategy.exit("Long_TP/SL","Long",limit=tp, stop=sl)

if (strategy.position_size < 0)
	tp:=tp[1]
	sl:=dn
	strategy.exit("Short_TP/SL","Short",limit=tp, stop=sl)


if buySignal
	tp:=close+(close-up)*0.382
    strategy.entry("Long", strategy.long,  limit=tp, comment=tostring(round(tp)))
if sellSignal
	tp:=close-(dn-close)*0.382
    strategy.entry("Short", strategy.short, limit=tp, comment=tostring(round(tp)))