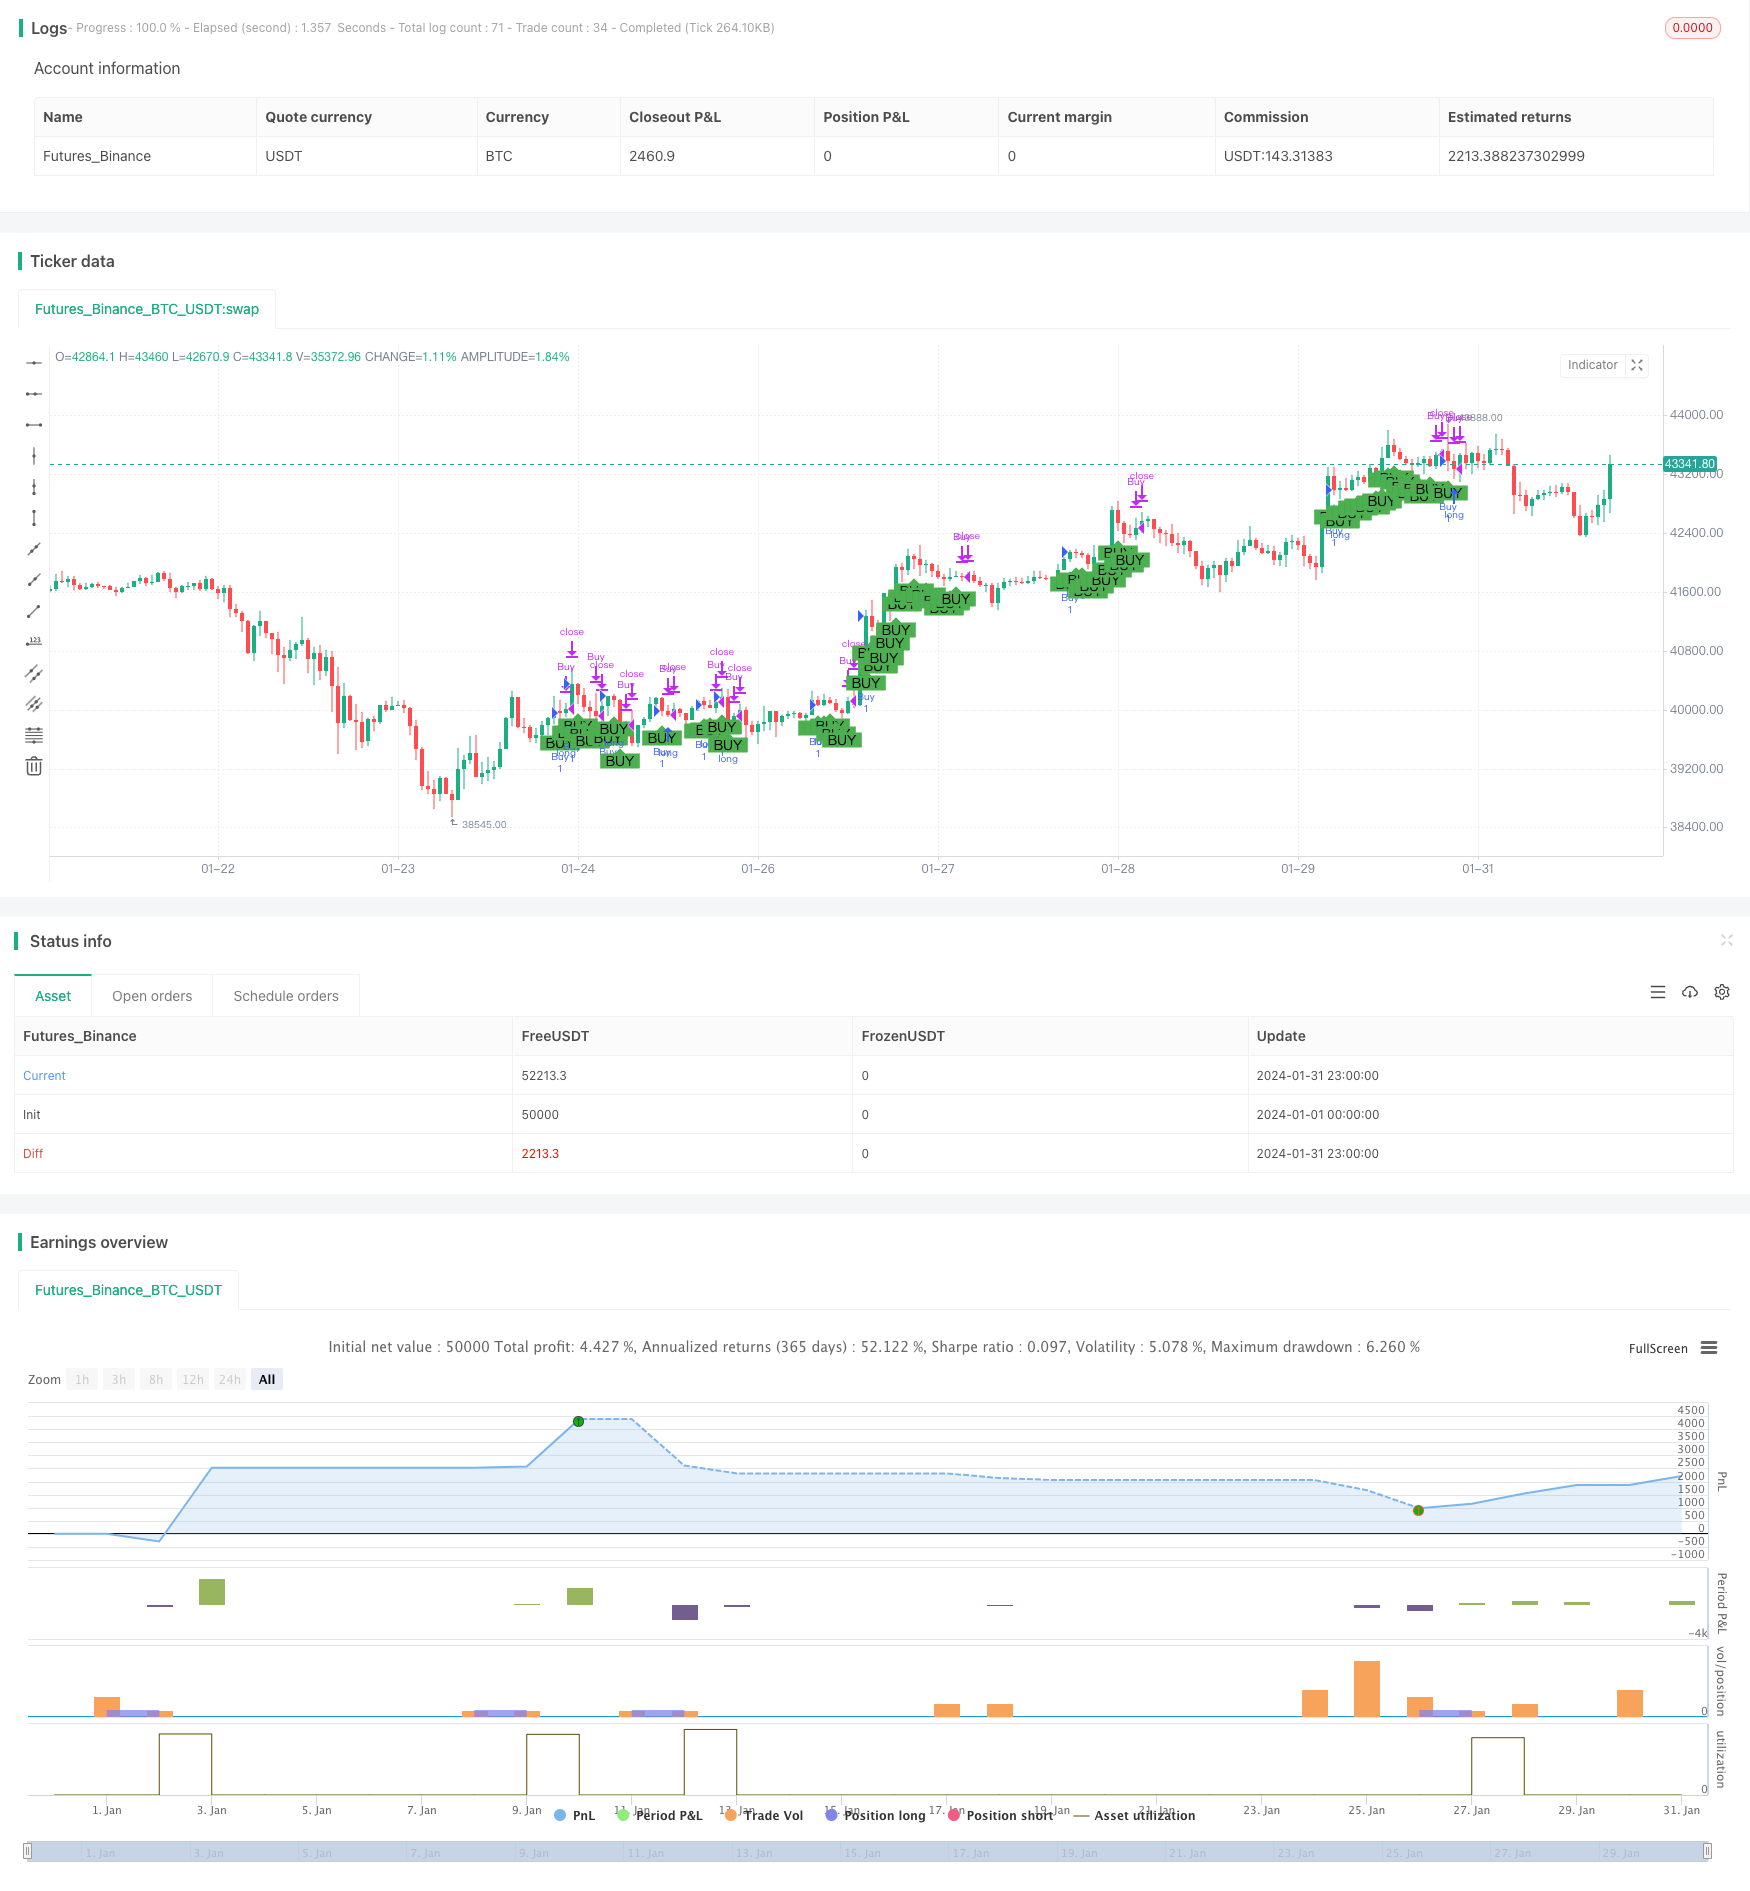
This strategy is an innovative Comprehensive Futures Automated Trading Strategy for Both Long and Short. It integrates SuperTrend, QQE and Trend Indicator A-V2 to automatically discover trading signals and make long/short trades. This strategy aims to identify main market trends and achieve steady profits with good risk control.
Strategy Principle
The strategy consists of three main parts:
SuperTrend indicator determines the main market trend. When price breaks above the up trendline, it indicates an uptrend. When price breaks below the down trendline, it indicates a downtrend.
QQE indicator combines RSI to identify overbought/oversold status. Dynamic overbought/oversold levels are calculated based on RSI average and standard deviation. RSI above upper level indicates overbought signal and RSI below lower level indicates oversold signal.
Trend Indicator A-V2 judges the trend by comparing fast and slow EMA lines. When fast EMA is higher than slow EMA, it sends a buy signal.
When judging market direction, long signals are triggered when SuperTrend shows uptrend, QQE not oversold and A-V2 buy signal occurs. Short signals are triggered when opposite conditions occur.
Advantages
Using multiple indicators improves reliability and reduces false signals.
Automated signal discovery without manual interference reduces human errors.
Organic combination of indicators provides effective risk control while discovering trading opportunities.
Customizable parameters to meet users’ needs.
Support both long-only and long/short trading for flexibility.
Risks and Solutions
Indicators may generate false signals under extreme market conditions. Fine-tune parameters to minimize such cases.
Transaction costs and slippage could erode profits. Optimize with stop loss/take profit.
Inadequate parameter setup leads to poor performance. Try different values to find optimal configuration.
Optimization Directions
Increase machine learning to auto optimize parameters based on historical data.
Incorporate more market micro-structure factors like volume to discover better signals.
Implement high frequency trading techniques to auto submit orders.
Conclusion
The strategy combines indicators to assess market structure and achieves steady profits under risk control. It considers both trend direction and overbought/oversold status for nuanced trading decisions. Much room remains for parameter optimization, logic improvements and execution enhancements to further lift strategy performance.
/*backtest
start: 2024-01-01 00:00:00
end: 2024-01-31 23:59:59
period: 1h
basePeriod: 15m
exchanges: [{"eid":"Futures_Binance","currency":"BTC_USDT"}]
*/

//@version=4
//author:盧振興 芙蓉中華中學畢業 育達科技大學畢業碩士
//參考資料 : QQE MOD By:Mihkel00 ,SuperTrend By:KivancOzbilgic , TrendIndicator A-V2 By:Dziwne

strategy("綜合交易策略", shorttitle="Comprehensive Strategy", overlay=true)

// 添加單邊或多空參數
OnlyLong = input(true, title="單邊")

// SuperTrend 参数
PeriodsST = input(9, title="ST ATR Period")
MultiplierST = input(3.9, title="ST ATR Multiplier")
srcST = input(hl2, title="ST Source")

atrST = atr(PeriodsST)
upST = srcST - (MultiplierST * atrST)
upST := close[2] > upST[1] ? max(upST, upST[1]) : upST
dnST = srcST + (MultiplierST * atrST)
dnST := close[2] < dnST[1] ? min(dnST, dnST[1]) : dnST
trendST = 1
trendST := nz(trendST[1], trendST)
trendST := trendST == -1 and close[2] > dnST[1] ? 1 : trendST == 1 and close[2] < upST[1] ? -1 : trendST

// QQE 参数
RSI_PeriodQQE = input(6, title='QQE RSI Length')
SFQQE = input(5, title='QQE RSI Smoothing')
QQE = input(3, title='QQE Fast Factor')
ThreshHoldQQE = input(3, title="QQE Thresh-hold")
srcQQE = input(close, title="QQE RSI Source")

Wilders_PeriodQQE = RSI_PeriodQQE * 2 - 1

RsiQQE = rsi(srcQQE, RSI_PeriodQQE)
RsiMaQQE = ema(RsiQQE, SFQQE)
AtrRsiQQE = abs(RsiMaQQE[1] - RsiMaQQE)
MaAtrRsiQQE = ema(AtrRsiQQE, Wilders_PeriodQQE)
darQQE = ema(MaAtrRsiQQE, Wilders_PeriodQQE) * QQE

basisQQE = sma(RsiMaQQE - 50, 50)
devQQE = 0.35 * stdev(RsiMaQQE - 50, 50)
upperQQE = basisQQE + devQQE
lowerQQE = basisQQE - devQQE

qqeCondition = RsiMaQQE[1] - 50 > upperQQE[1] ? true : RsiMaQQE[1] - 50 < lowerQQE[1] ? false : na

// Trend Indicator A-V2 参数
ma_periodA_V2 = input(52, title="TIA-V2 EMA Period")
oA_V2 = ema(open, ma_periodA_V2)
cA_V2 = ema(close, ma_periodA_V2)
trendIndicatorAV2Condition = cA_V2[1] >= oA_V2[1] ? true : false

// 综合交易逻辑
longCondition = trendST == 1 and qqeCondition and trendIndicatorAV2Condition
shortCondition = trendST == -1 and not qqeCondition and not trendIndicatorAV2Condition

// 针对多单的开平仓逻辑
if (OnlyLong)
    if (longCondition)
        strategy.entry("Buy", strategy.long)
    else
        strategy.close("Buy")

// 多空都做时的逻辑
if (not OnlyLong)
    if (longCondition)
        strategy.entry("Buy", strategy.long)
    else if (shortCondition)
        strategy.entry("Sell",strategy.short)

    // 添加多空平仓逻辑
    if (not longCondition)
        strategy.close("Buy")
    if (not shortCondition)
        strategy.close("Sell")

// 可视化信号
plotshape(series=longCondition, title="Buy Signal", location=location.belowbar, color=color.green, style=shape.labelup, text="BUY")
plotshape(series=shortCondition and not OnlyLong, title="Sell Signal", location=location.abovebar, color=color.red, style=shape.labeldown, text="SELL")