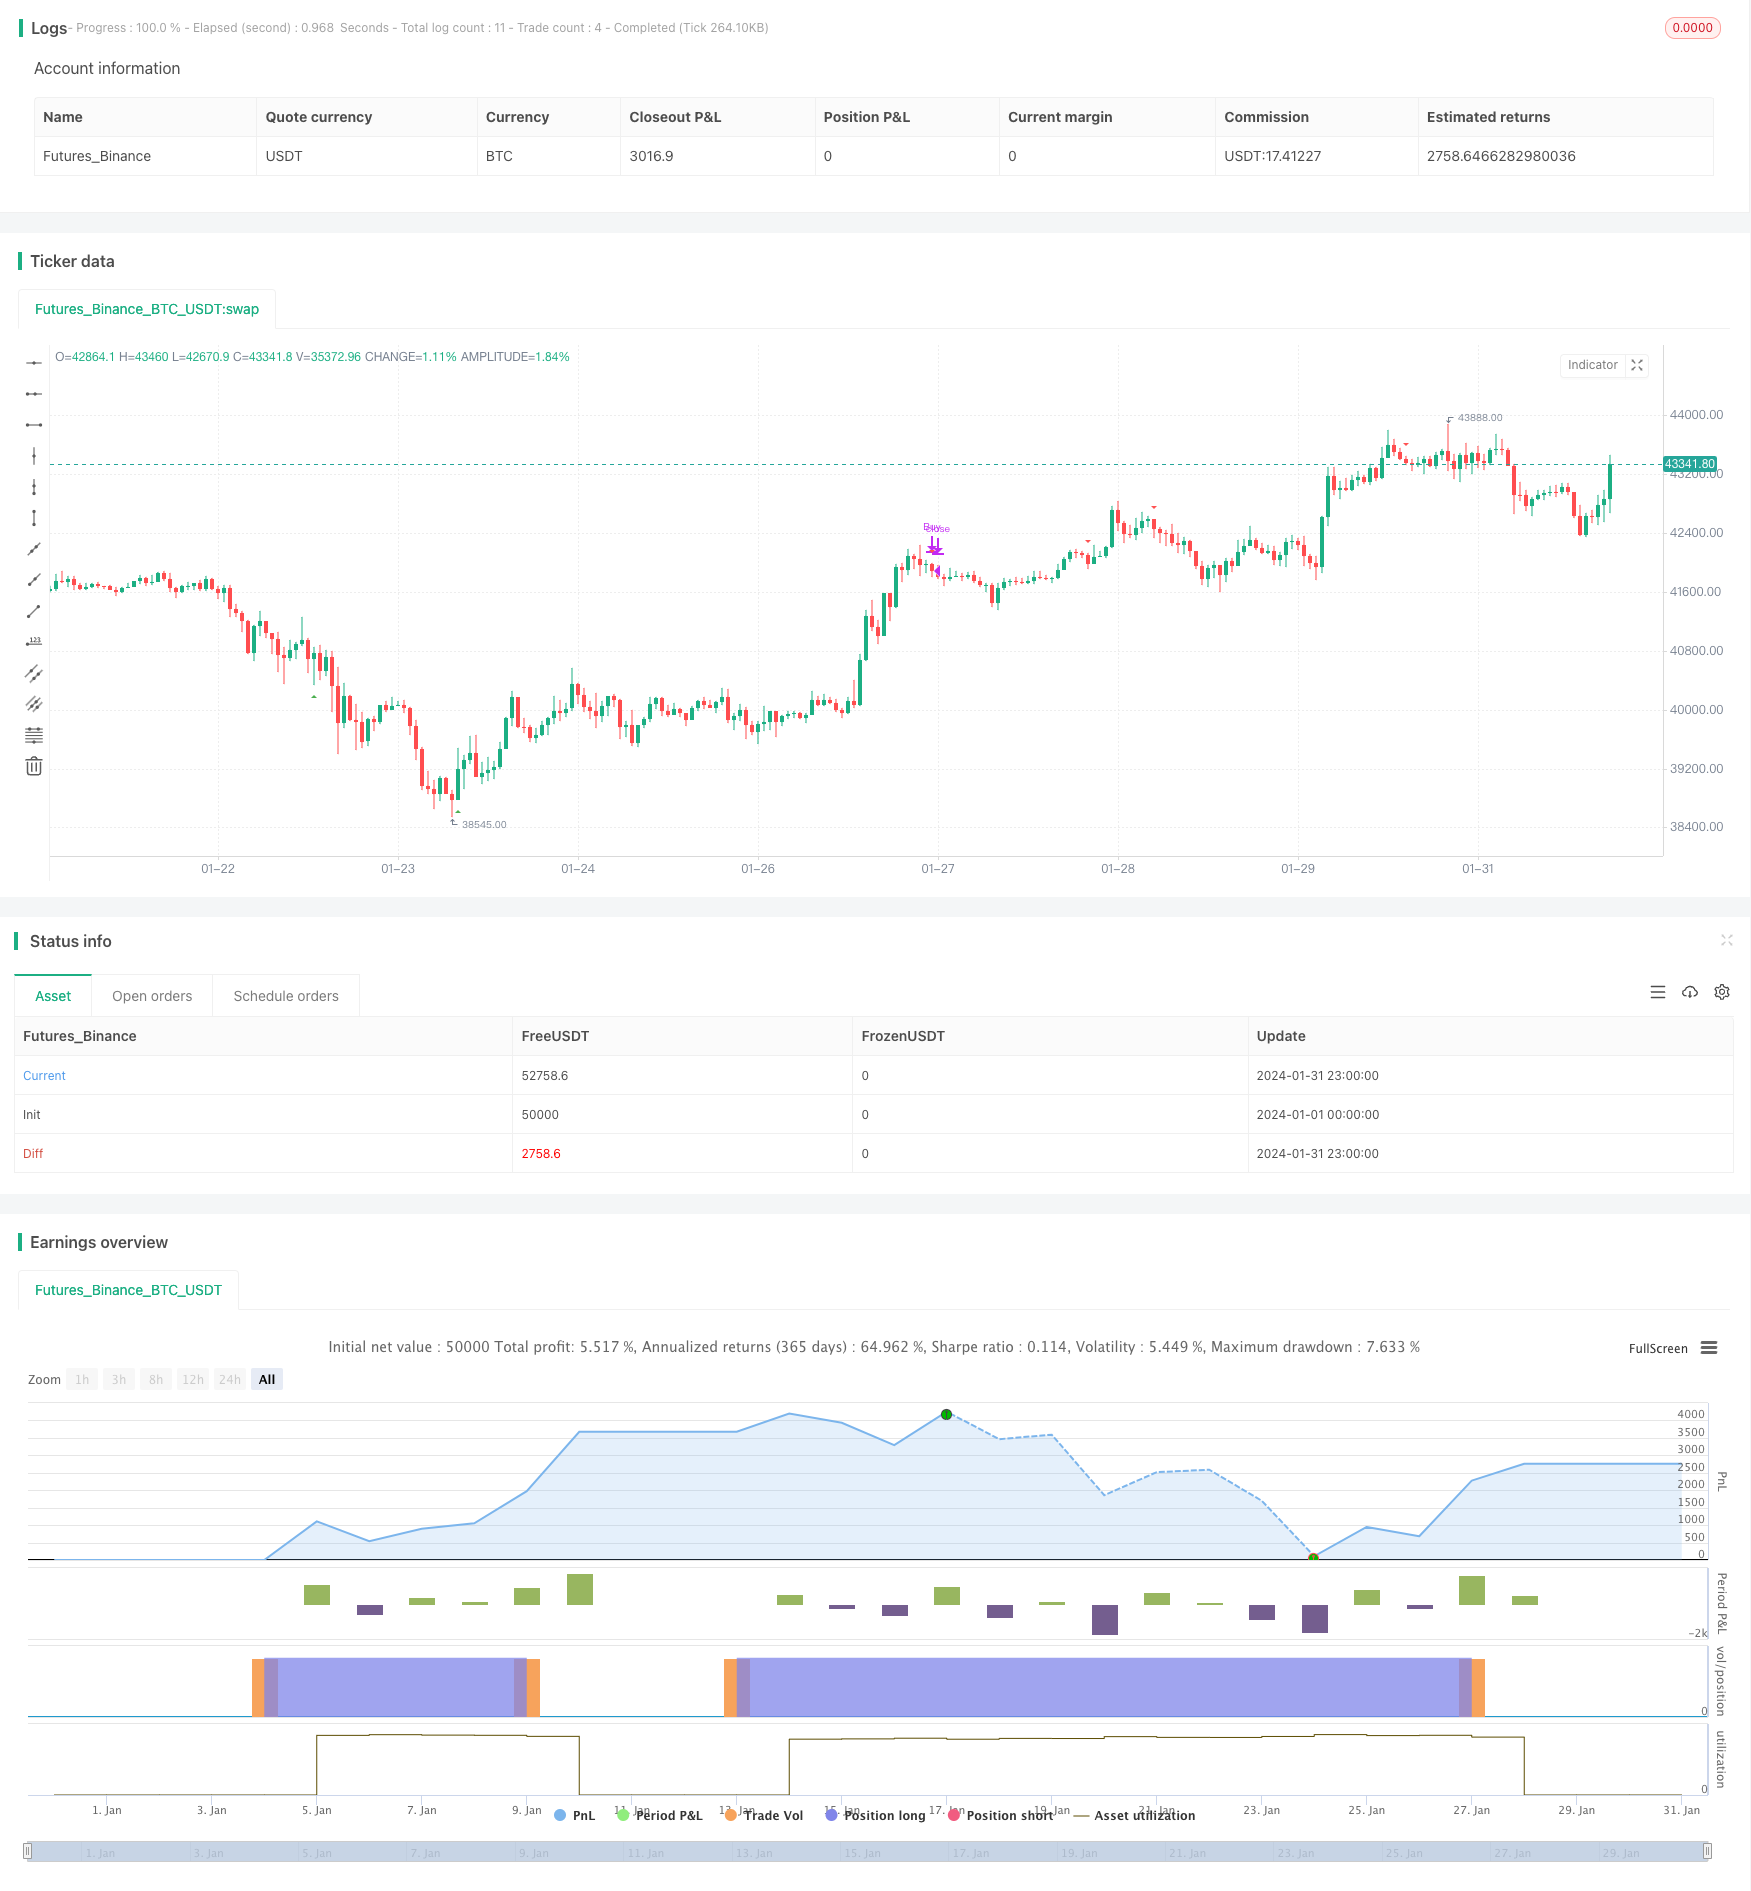
Strategy Summary
This strategy combines the MACD and RSI indicators to identify trend reversal points for buy low and sell high operations. It generates buy signals when the MACD line crosses above the signal line while RSI is oversold, and sell signals when the MACD line crosses below the signal line while RSI is overbought.
Strategy Principle
MACD Indicator
The MACD indicator consists of the MACD line, signal line and histogram. The MACD line is faster while The signal line is slower. When MACD line crosses above signal line, a buy signal is generated indicating an upward trend. When MACD line crosses below signal line, a sell signal is generated indicating a downward trend.
RSI Indicator
The RSI oscillator reflects overbought/oversold levels in the market. RSI above 70 suggests overbought conditions while RSI below 30 suggests oversold conditions.
Strategy Rules
Buy Condition: MACD line crosses above Signal line (Golden Cross) AND RSI is below 40 (oversold level).
Sell Condition: MACD line crosses below Signal line (Death Cross) AND RSI is above 60 (overbought level).
The strategy identifies trend directions using the MACD indicator and determines potential reversal points using the overbought/oversold levels from the RSI indicator.
Advantage Analysis
Improves strategy stability and win rate by combining indicators. MACD identifies trend direction and RSI identifies reversal timing, enhancing signal reliability.
Effectively captures key reversal points utilizing both indicators. RSI overbought/oversold levels combined with MACD crossovers precisely spot trend shifts.
Simple clear trading signals and rules. Signals come from two well-known indicators with clearly defined rules for straightforward execution.
Flexibility for optimizations. Parameters of both indicators and additional technical indicators can be incorporated for enriching rules.
Risk Analysis
Risk of consecutive losing trades on false signals and fakeouts. Unnecessary losses may be incurred during choppy price actions.
Lack of risk management mechanisms. No stop loss in place may lead to amplified losses in long run.
Failure risk of MACD and RSI. These two indicators tend to give excessive false signals during sideways or special market conditions.
Blind optimizations risk. Inappropriate optimizations without sufficient market knowledge could lead to overfitting.
Risks can be reduced by implementing stop loss, assessing market conditions, cautious parameter tuning, and combining indicators. This improves strategy stability.
Optimization Directions
Add stop loss mechanisms to limit downside risk. Consider trailing stop or percentage-based stop loss.
Evaluate multiple timeframes for optimal indicator parameters and signals.
Additional filter indicators (MA, KDJ etc) to filter false signals and confirm signals.
Parameter optimization through extensive backtests to find optimal indicator parameters.
Adjust position sizing according to symbol and account specifications.
Summary
This strategy combines two widely used indicators MACD and RSI for complementarity in signal generations. The advantages lie in its simplicity and flexibility for customizations. Further improvements can be made by adding stop loss, optimizing parameters, and filtering signals to enhance strategy stability and profitability.
/*backtest
start: 2024-01-01 00:00:00
end: 2024-01-31 23:59:59
period: 1h
basePeriod: 15m
exchanges: [{"eid":"Futures_Binance","currency":"BTC_USDT"}]
*/

//@version=5
strategy("MACD and RSI Strategy", shorttitle="MRS long", overlay=true)

// Define input parameters
fast_length = input.int(5, title="MACD Fast Length")
slow_length = input.int(35, title="MACD Slow Length")
signal_smoothing = input.int(5, title="MACD Signal Smoothing")
rsi_length = input.int(14, title="RSI Length")

// Calculate MACD with custom signal smoothing
[macdLine, signalLine, _] = ta.macd(close, fast_length, slow_length, signal_smoothing)

// Calculate RSI
rsi = ta.rsi(close, rsi_length)

// Define buy and close conditions
buy_condition = ta.crossover(macdLine, signalLine) and rsi < 40
sell_condition = ta.crossunder(macdLine, signalLine) and rsi > 60

// Define Sell and close conditions
b_condition = ta.crossunder(macdLine, signalLine) and rsi < 40
s_condition = ta.crossover(macdLine, signalLine) and rsi > 75

// Plot buy and sell signals on the chart
plotshape(buy_condition ? 1 : na, style=shape.triangleup, location=location.belowbar, color=color.green, size=size.small, title="Buy Signal")
plotshape(sell_condition ? 1 : na, style=shape.triangledown, location=location.abovebar, color=color.red, size=size.small, title="Sell Signal")

// Strategy entry and exit conditions
if (buy_condition)
    strategy.entry("Buy", strategy.long)
if (sell_condition)
    strategy.close("Buy")

// if (s_condition)
//     strategy.entry("Sell", strategy.short)
// if (b_condition)
//     strategy.close("Sell")