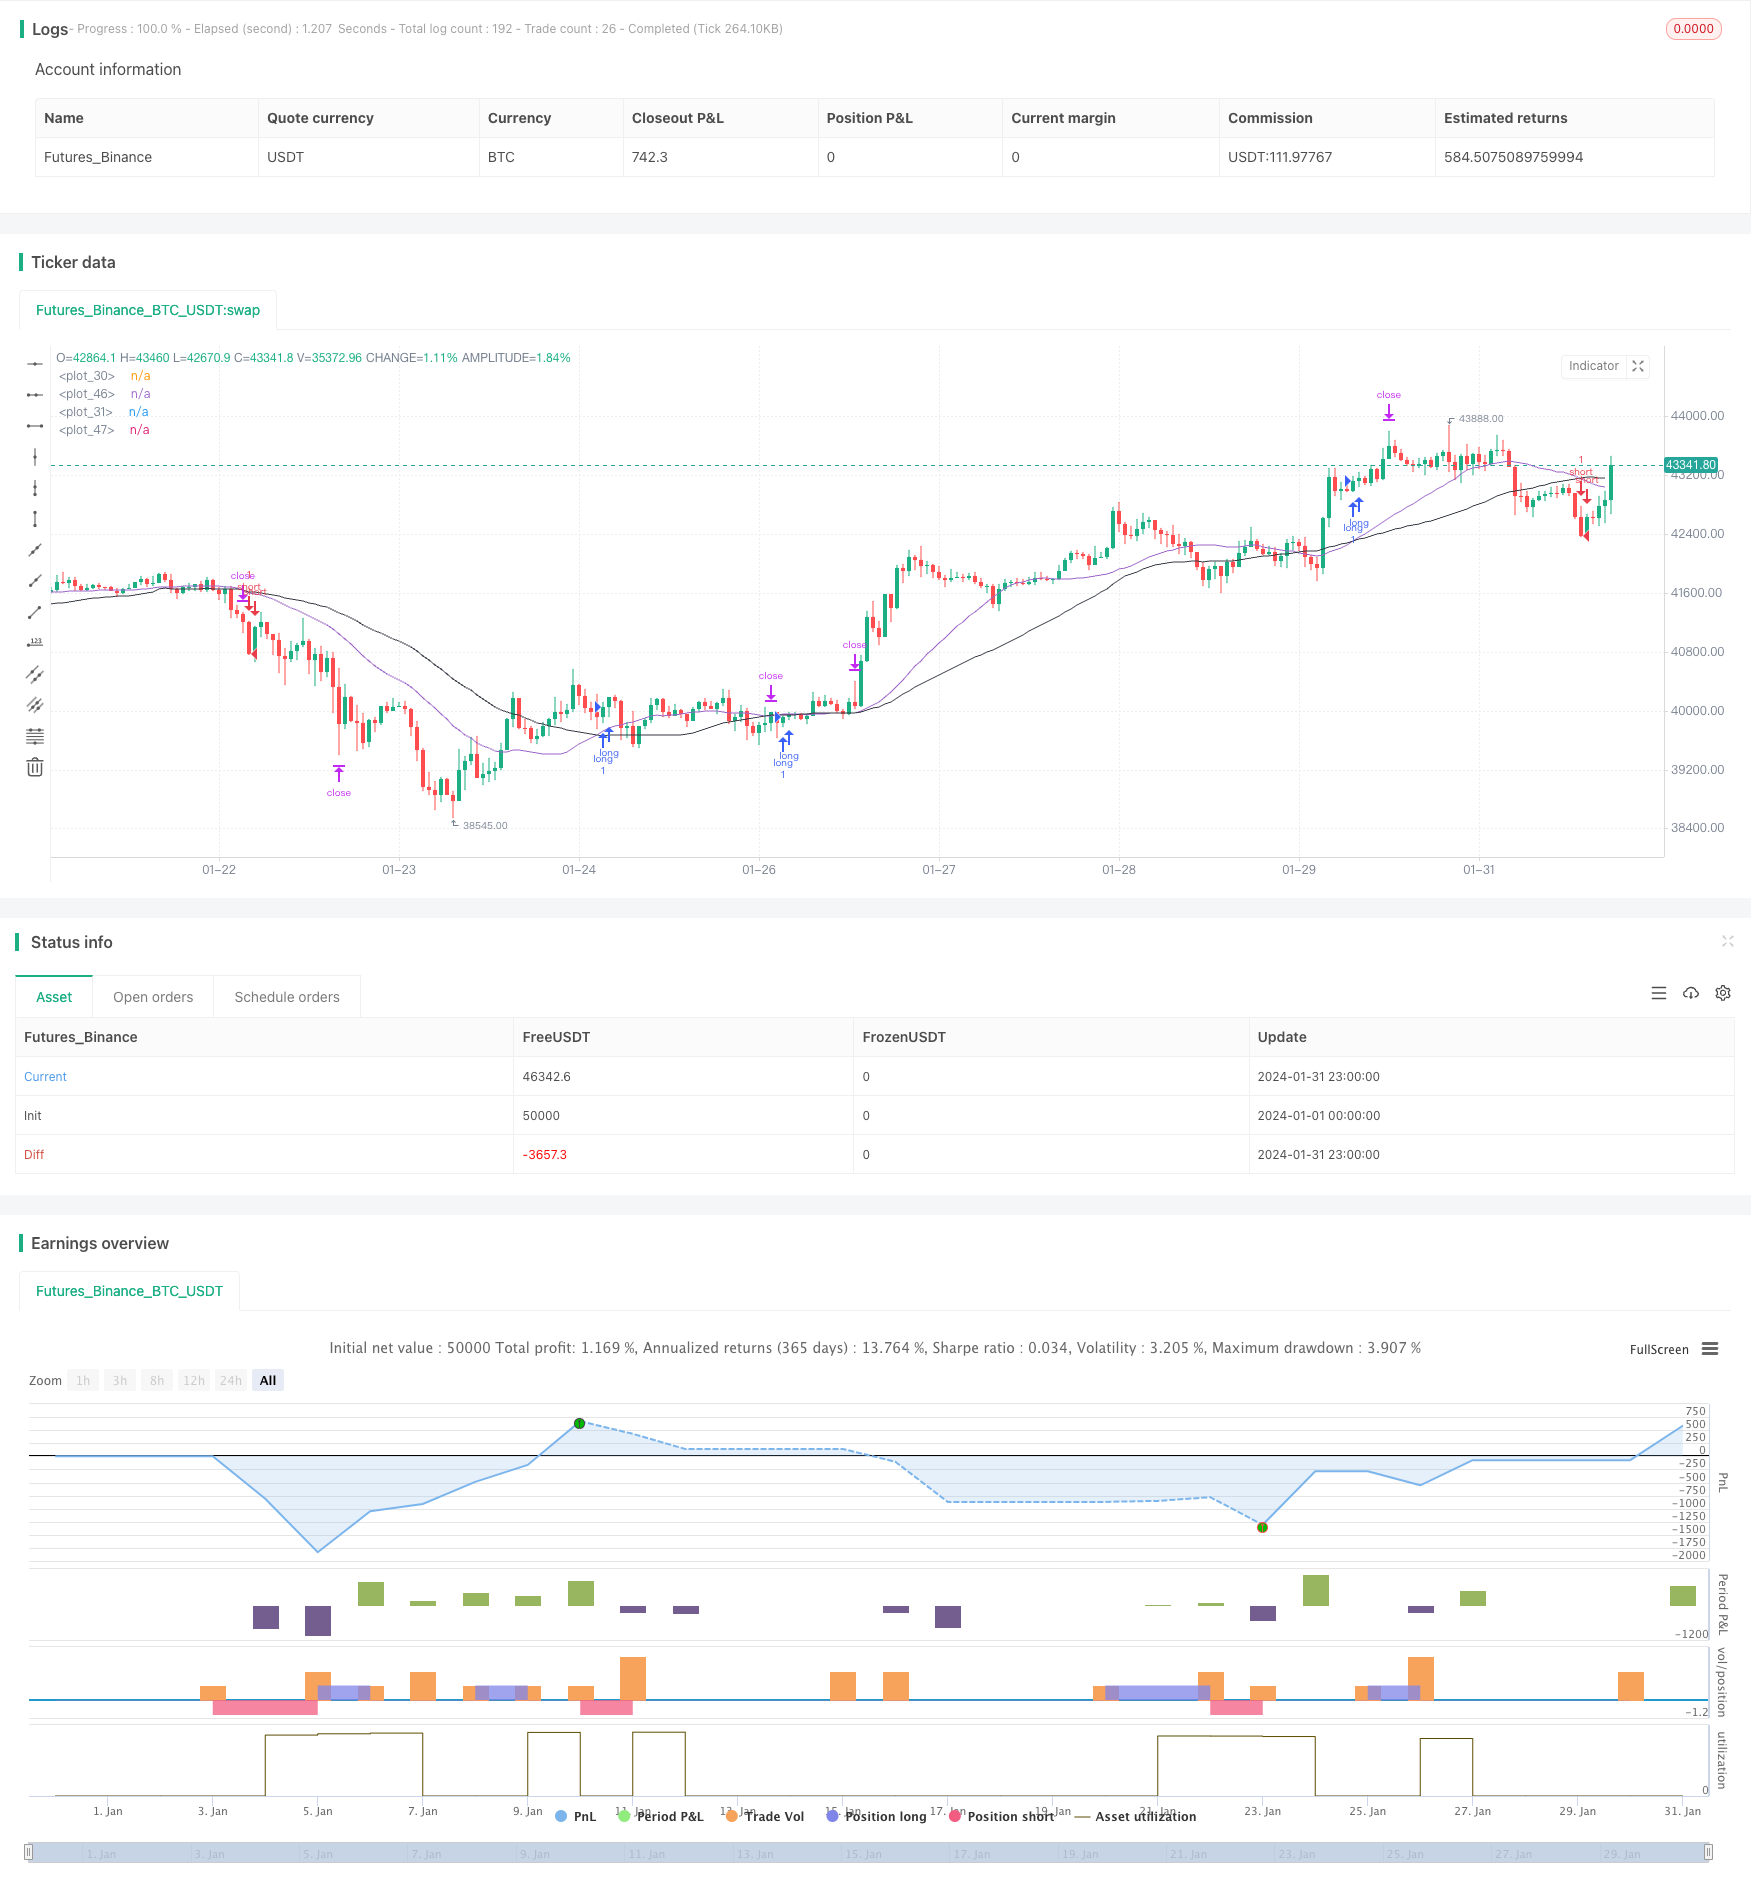
Overview
This strategy combines the moving average (EMA), relative strength index (RSI) and moving average convergence divergence (MACD) indicators to find trading opportunities across multiple timeframes and enable automated trading. It can effectively track market trends and reduce trading risks.
Strategy Principle
The strategy is mainly based on the EMA, RSI and MACD indicators. The trading logic is as follows:
Use 25-day EMA and 45-day EMA to form golden crosses and death crosses as trading signals. Buy when the short term EMA crosses above the long term EMA, and sell when the short term EMA crosses below the long term EMA.
Incorporate the RSI indicator to avoid false breakouts. Only take buy signals from golden crosses when RSI is greater than 50; only take sell signals from death crosses when RSI is less than 50.
Find more trading opportunities under different RSI parameter settings, including RSI>30, RSI<30 etc.
MACD indicator can be used as an auxiliary judgement tool to confirm the EMA trading signals.
By finding more trading chances across different timeframes, the strategy’s profitability can be improved. Meanwhile, the integration of multiple indicators helps reduce erroneous trades and effectively control risks.
Advantages of the Strategy
The biggest strength of this strategy lies in the combination of multiple indicators and trading across timeframes, which improves the odds of winning trades. The main advantages are:
EMA crosses can effectively track trend changes in the market and timely capture trading opportunities.
RSI indicator helps avoid false breakouts and reduce trading risks.
More entry opportunities via different RSI parameter settings improve profitability.
MACD provides secondary confirmation of EMA signals to further decrease risks.
Multi timeframe trading doubles profit making chances.
Risks of the Strategy
There are also some risks with this strategy:
EMA has lags that may lead to missing short-term trading chances.
Improper parameter tuning in the multi-indicator combo may cause over-optimization.
Multi timeframe trading may compound losses, demanding strict stop loss management.
Transaction costs need monitoring in live trading environments to avoid over-trading.
Optimization Directions
There is room for further optimization of the strategy:
Test and optimize EMA parameters for best combination.
Test more auxiliary indicators like BOLL bands, KD etc.
Incorporate adaptive stop loss mechanism based on market volatility.
Optimize position sizing under different parameter settings.
Improve entry logic to eliminate conflicting signals or increase filtering power.
Conclusion
This strategy integrates signals across indicators and timeframes, capable of both tracking trends and capturing short-term opportunities. Meanwhile, the strict entry mechanisms also equip the strategy with decent risk control capacities. In general, this is a strategy with stable returns and practical value, worth recommending.
/*backtest
start: 2024-01-01 00:00:00
end: 2024-01-31 23:59:59
period: 1h
basePeriod: 15m
exchanges: [{"eid":"Futures_Binance","currency":"BTC_USDT"}]
*/

// This Pine Script™ code is subject to the terms of the Mozilla Public License 2.0 at https://mozilla.org/MPL/2.0/
// © Aqualizer

//@version=5
strategy("Aserin Buy and Sell", overlay=true)

shortSMA = ta.sma(close, 25)
longSMA = ta.sma(close, 45)
rsi = ta.rsi(close, 7)
ta.macd(close,12, 26, 9)
atr = ta.atr(3)
longCondition = ta.crossover(shortSMA, longSMA)
shortCondition = ta.crossunder(shortSMA, longSMA)

if (longCondition)
    strategy.entry("long", strategy.long, 100, when = rsi > 50)
if (shortCondition)
    strategy.entry("short", strategy.short, 100, when = rsi < 50)

if (longCondition)
    strategy.entry("long", strategy.long, 100, when = rsi > 30)
if (shortCondition)
    strategy.entry("short", strategy.short, 100, when = rsi < 30)

if (longCondition)
    strategy.entry("long", strategy.long, 100, when = rsi > 20)
if (shortCondition)
    strategy.entry("short", strategy.short, 100, when = rsi < 50)

plot(shortSMA)
plot(longSMA, color=color.black)

if (longCondition)
    stopLoss = low - atr * 2,45
    takeProfit = high + atr * 2,45
    strategy.entry("long", strategy.long, 1, when = rsi > 30)

    strategy.exit("exit", "long", stop=stopLoss, limit=takeProfit)

if (shortCondition)
    stopLoss = high + atr * 3
    takeProfit = low - atr * 3
    strategy.entry("short", strategy.short, 1, when = rsi < 30)
    strategy.exit("exit", "short", stop=stopLoss, limit=takeProfit)

plot(shortSMA)
plot(longSMA, color=color.black)