Summary
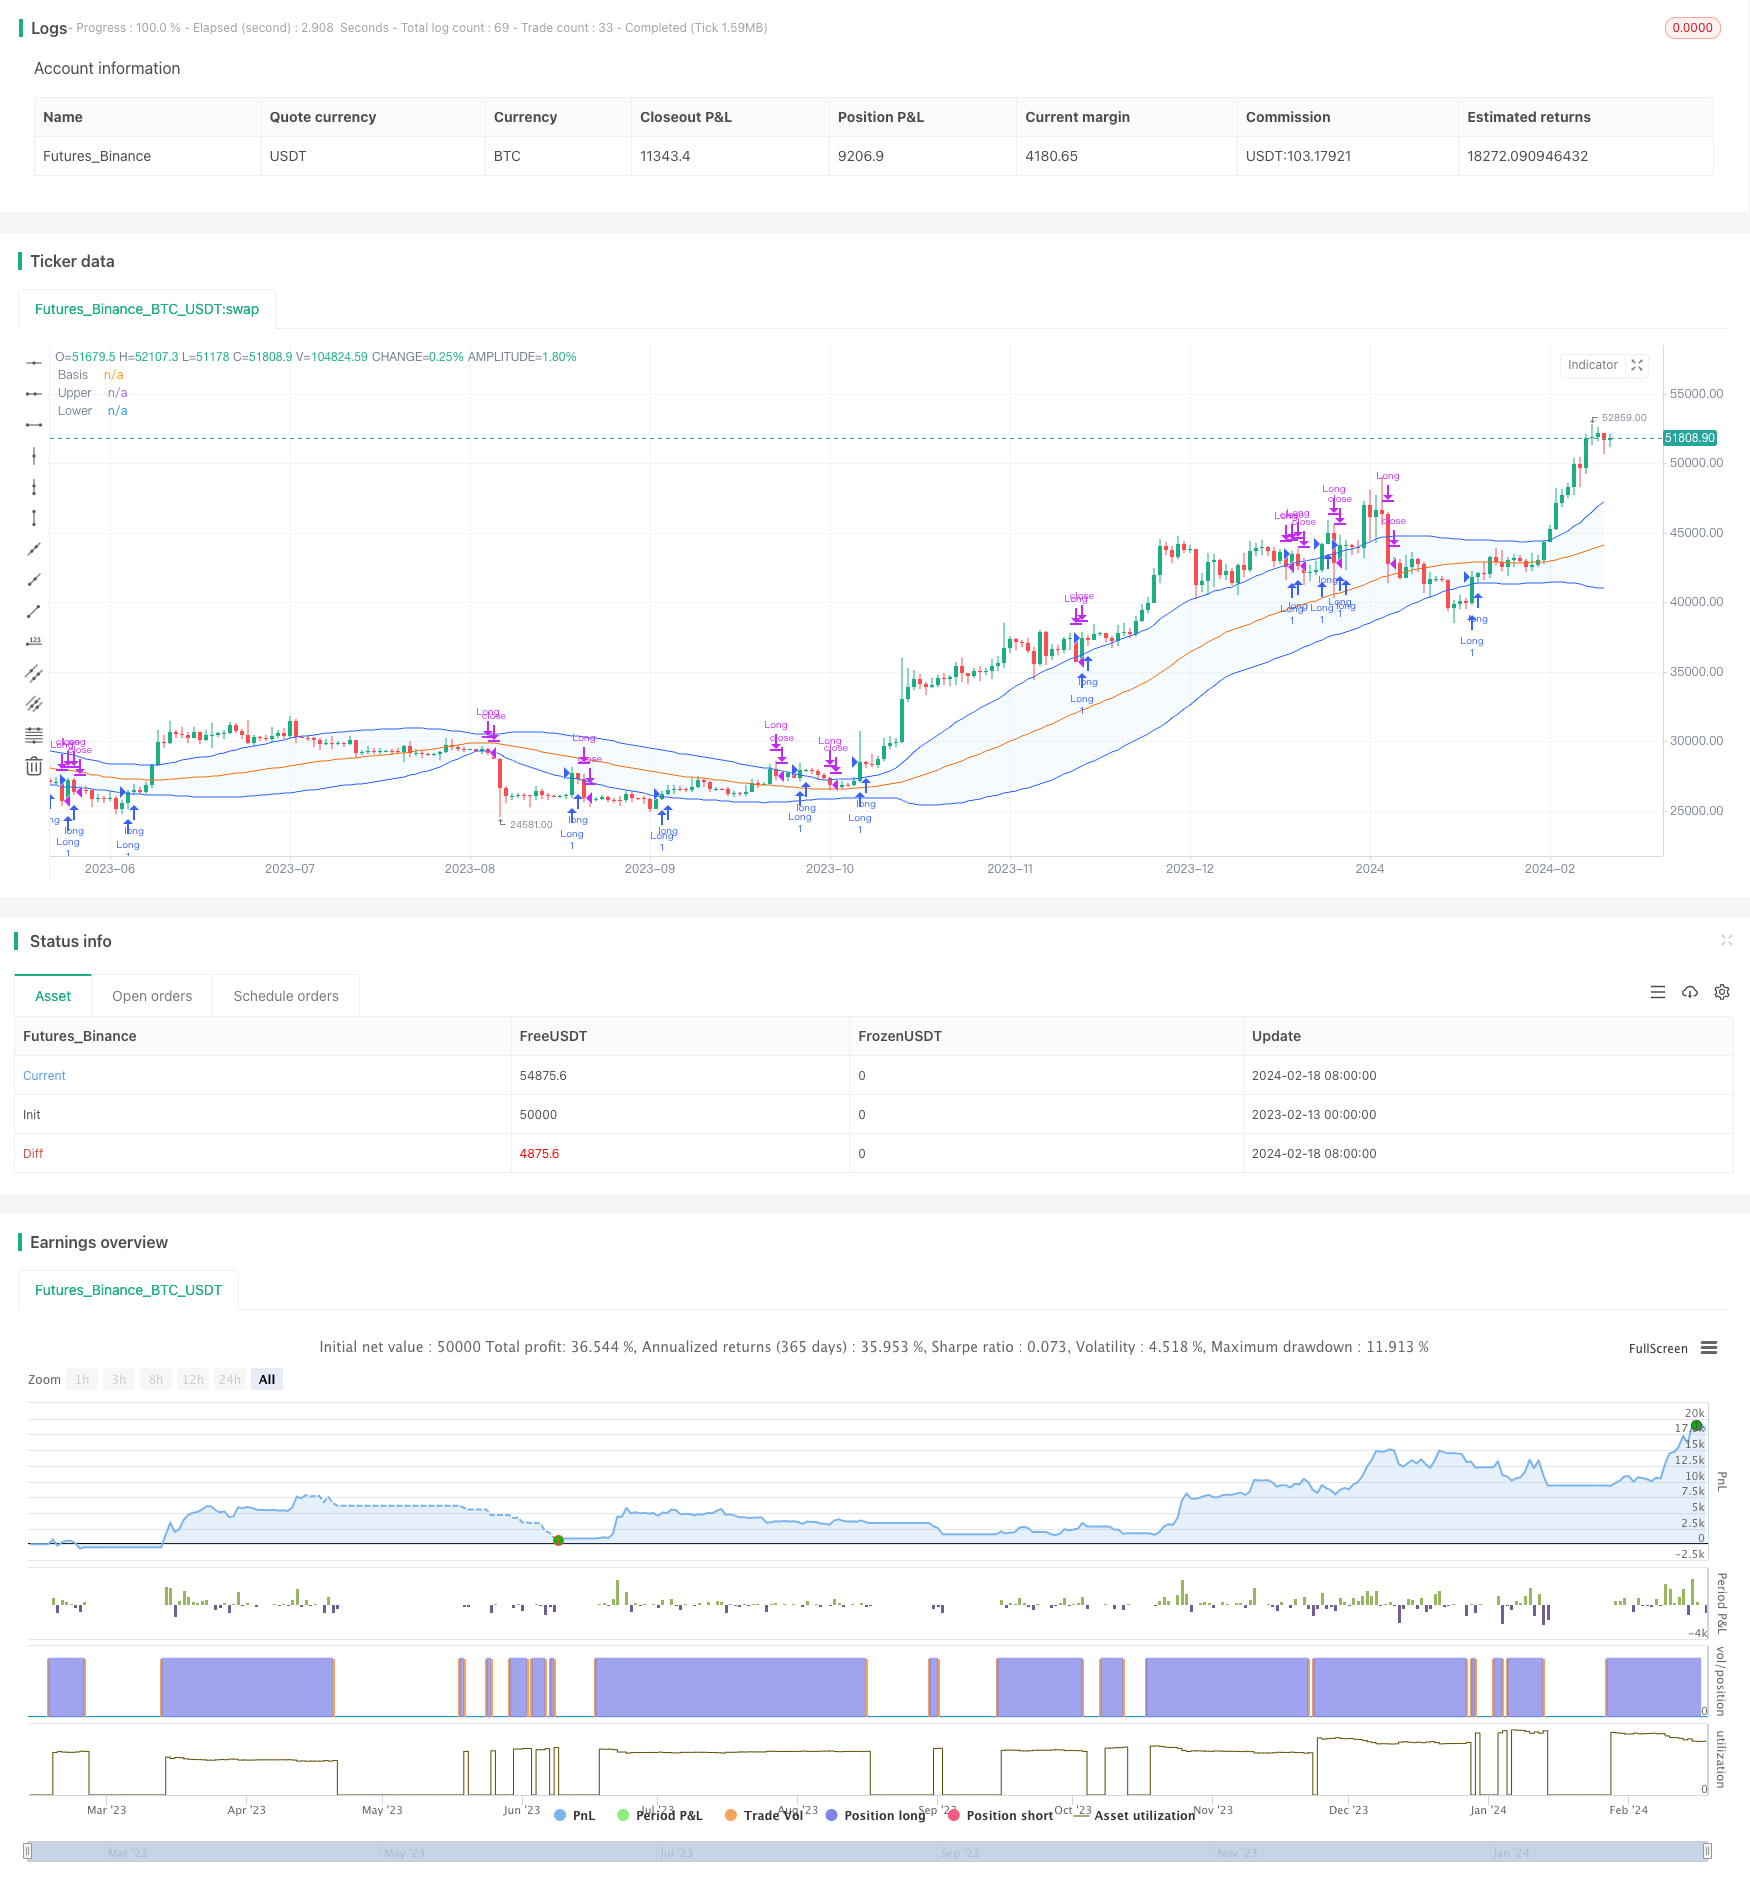
The Bollinger Bands Repetitive Zona Strategy is a quantitative trading strategy based on Bollinger Bands. The strategy uses the price range between the upper and lower bands of Bollinger Bands to determine the range of market volatility and identify potential entry and exit points.
Principles
The strategy mainly relies on the following indicators for judgment:
Bollinger Middle Band: Simple Moving Average SMA, representing the overall market trend.
Bollinger Upper Band: Middle + N times standard deviation. The upper band represents the upper limit of market volatility.
Bollinger Lower Band: Middle - N times standard deviation. The lower band represents the lower limit of market volatility.
When the closing price is higher than the lower rail and the opening price is lower than the lower rail, it is judged as a potential bottom and a possible entry point. When the closing price is higher than the upper rail and the opening price is lower than the upper rail, it is judged as a potential breakout signal above the upper rail, which can also enter the market.
When the closing price is lower than the upper rail and the opening price is higher than the upper rail, it is determined that it has entered the upper part of the Bollinger Band and exit should be considered. When the closing price is higher than the opening price and the distance between the upper and lower rails exceeds 2 times the middle line, it is judged that the volatility has increased, and exit should also be considered.
Advantage Analysis
The combination of double rail judgment improves the accuracy of signals. The combination of closing price and opening price can filter out some false signals.
Volatility range is calculated based on standard deviation, automatically adapting to market changes. No need to manually set fixed price ranges.
Combined with trend judgment of middle line to avoid repeated shocks in the market without a trend.
Use middle rail breakthrough to determine trend reversal points. Can grasp potential opportunities in a timely manner.
Risk Analysis
Medium-term operating strategies are not suitable for long-term holdings. Need to closely monitor market conditions for timely stop loss.
Bollinger Bands are only valid within a certain timeframe. Improper parameter settings can easily generate false signals.
In a range-bound market, the middle line fluctuates greatly, and the alternate triggering of upper and lower rails may be more frequent. At this point, the position size should be reduced or operations should be temporarily suspended.
Optimization Directions
Adjust parameters to adapt to longer time cycles. Methods such as increasing cycle length and using exponential moving averages can optimize middle rail algorithms.
Add volatility indicators such as ATR to further avoid false breakthroughs. ATR prebuilt values can be set as filtering conditions, and trading signals are generated only when volatility exceeds a certain range.
Combine other indicators to achieve the Barry filter effect. For example, add transaction volume judgment rules, only operate when transaction volume expands.
Summary
The Bollinger Bands repetitive zona strategy automatically identifies potential extremes in the market to define price channels as potential trading opportunities. It is very suitable for capturing medium-term price reversals and can supplement trend tracking strategies. Through reasonable optimization, risks can be effectively controlled and profitability improved.
/*backtest
start: 2023-02-13 00:00:00
end: 2024-02-19 00:00:00
period: 1d
basePeriod: 1h
exchanges: [{"eid":"Futures_Binance","currency":"BTC_USDT"}]
*/

//@version=5
strategy("BB Strategy", shorttitle="BB", overlay=true)

length = input.int(55, minval=1)
maType = input.string("SMA", "Basis MA Type", options = ["SMA", "EMA", "SMMA (RMA)", "WMA", "VWMA"])
src = input(close, title="Source")
mult = input.float(1., minval=0.001, maxval=50, title="StdDev")

ma(source, length, _type) =>
    switch _type
        "SMA" => ta.sma(source, length)
        "EMA" => ta.ema(source, length)
        "SMMA (RMA)" => ta.rma(source, length)
        "WMA" => ta.wma(source, length)
        "VWMA" => ta.vwma(source, length)

basis = ma(src, length, maType)
dev = mult * ta.stdev(src, length)
upper = basis + dev
lower = basis - dev

// Entry conditions
enterCondition = (close > lower and open < lower and close > open) or (close > upper and open < upper and close > open)

// Exit conditions
exitCondition = (close < upper and open > upper) or (close > open and (upper - lower) > 2 * basis) or (close < lower)

strategy.entry("Long", strategy.long, when=enterCondition)
strategy.close("Long", when=exitCondition)

// Plotting
offset = input.int(0, "Offset", minval = -500, maxval = 500)
plot(basis, "Basis", color=#FF6D00, offset = offset)
p1 = plot(upper, "Upper", color=#2962FF, offset = offset)
p2 = plot(lower, "Lower", color=#2962FF, offset = offset)
fill(p1, p2, title = "Background", color=color.rgb(33, 150, 243, 95))