Log Ichimoku Cross Variety Strategy
Author: ChaoZhang, Date: 2024-02-22 13:53:30Tags:

Overview
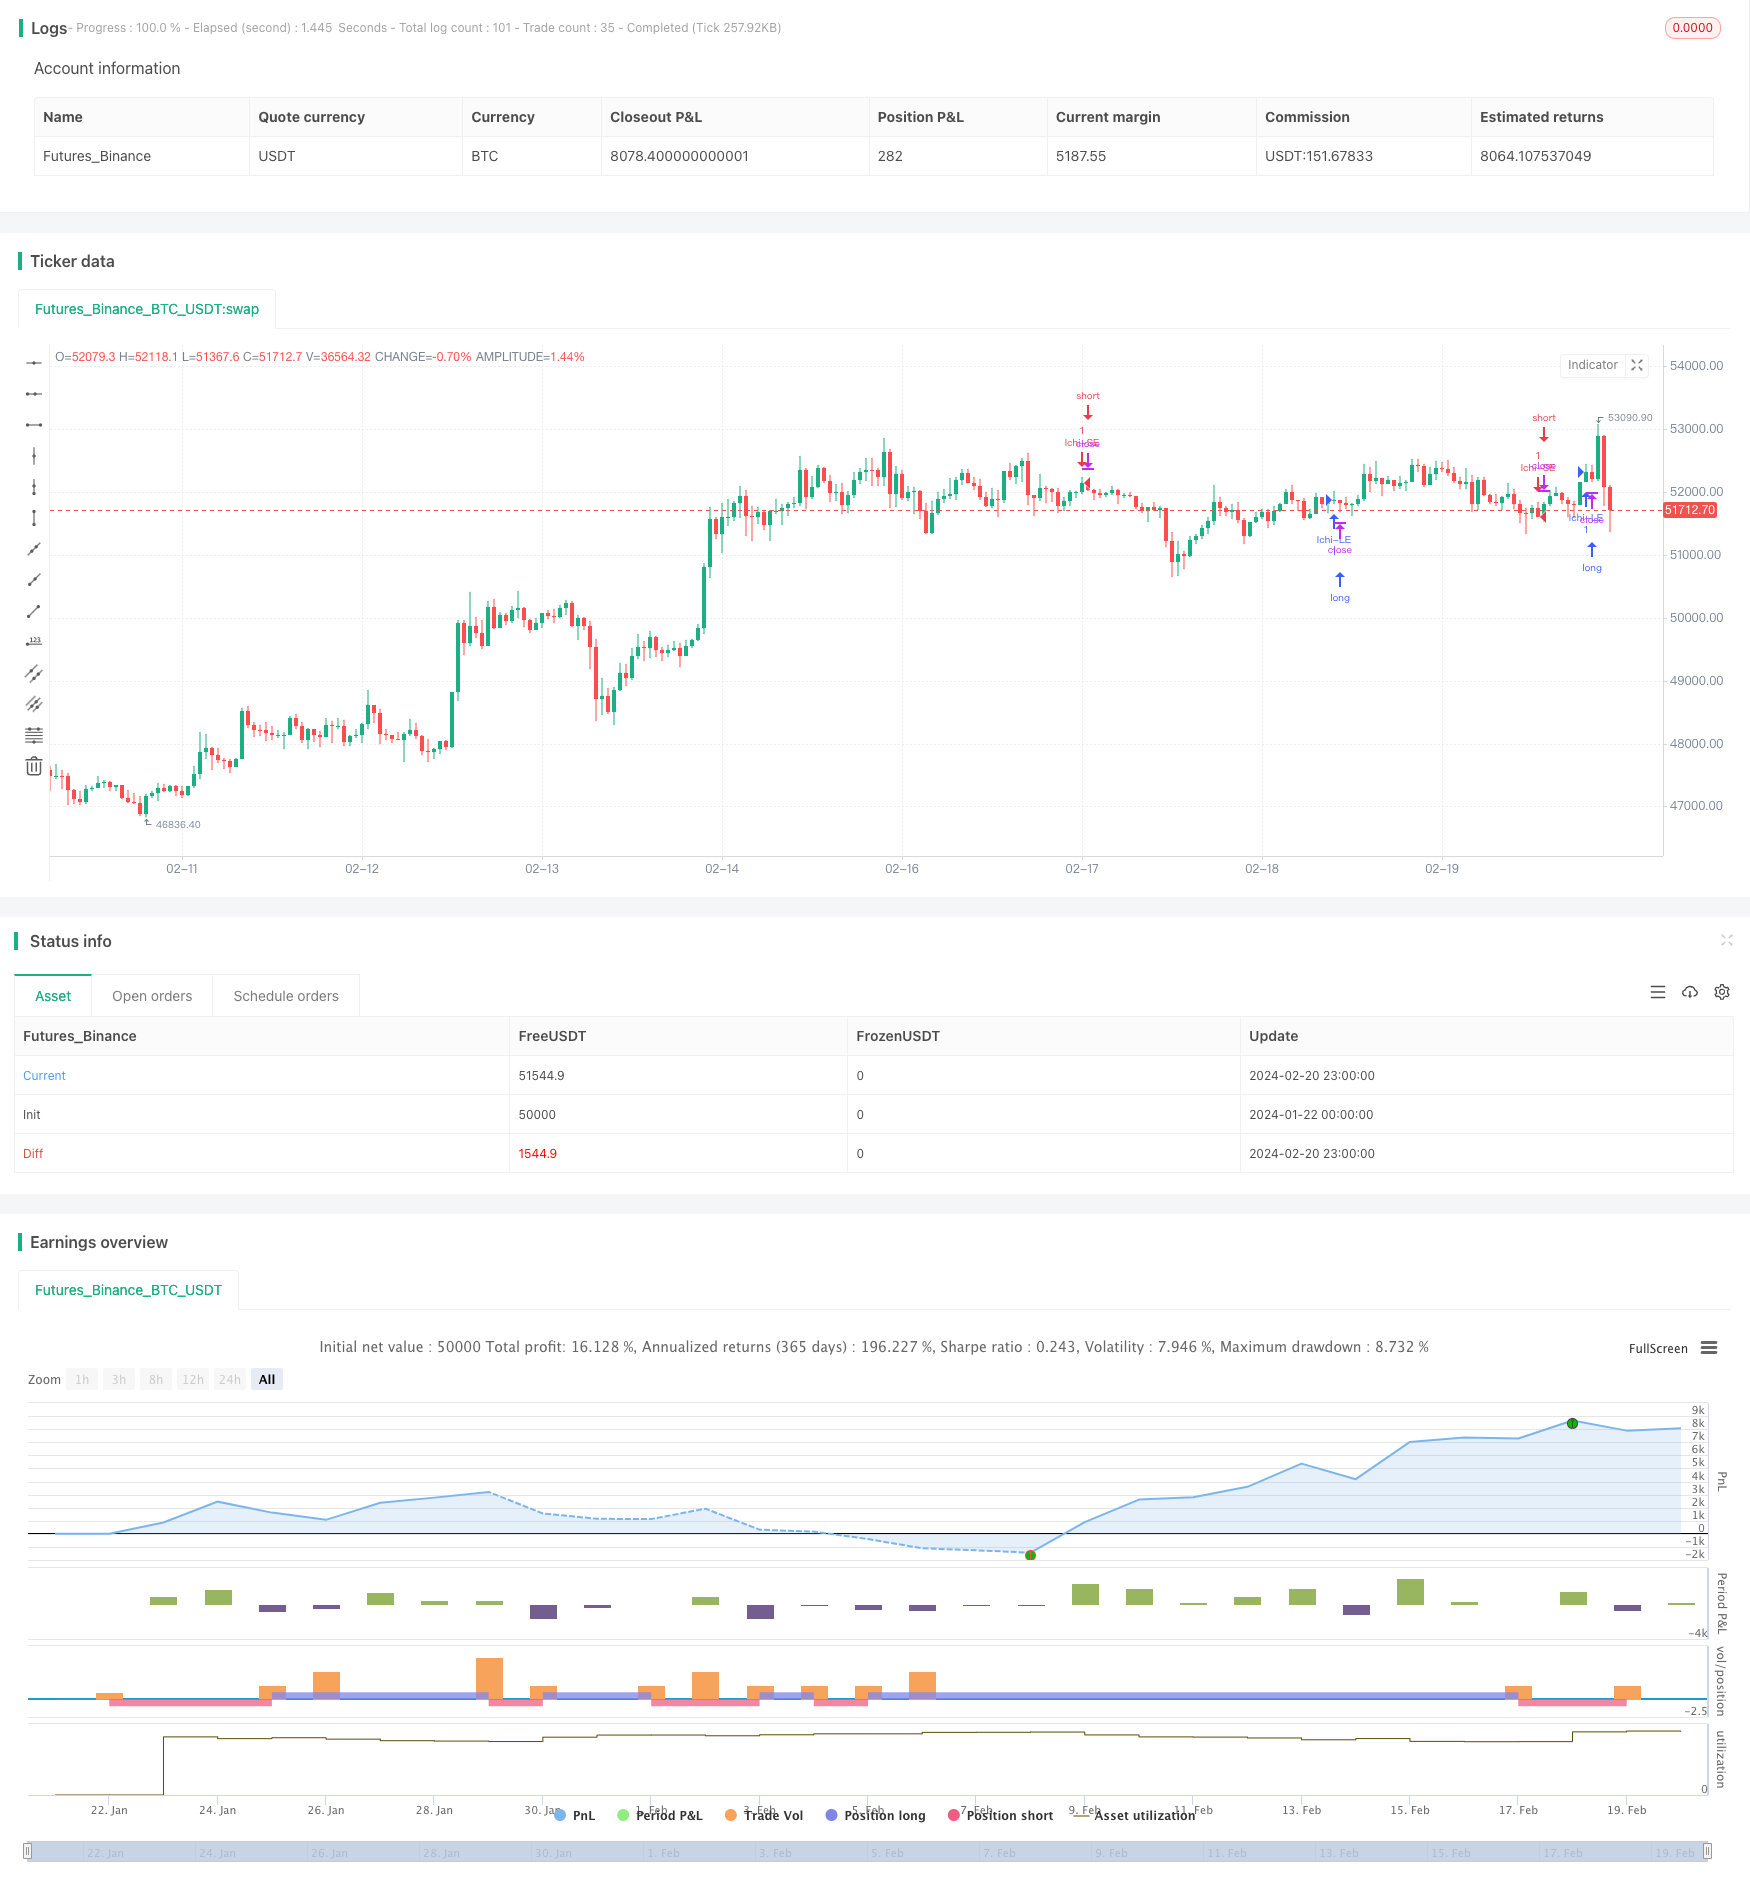
This strategy is a simple cryptocurrency trading strategy that uses log-scale Ichimoku clouds to generate trading signals. It is designed for cross-cryptocurrency trading between varieties.
Strategy Logic
The strategy uses a custom log-scale Ichimoku indicator as the primary trading indicator. The Ichimoku indicator usually contains the conversion line, base line and lagging span. In this strategy, these lines are calculated in logarithmic price space.
Specifically, the conversion line is the recent 9-period mean of the log lows and log highs. The base line is the 26-period mean of the same. Lead line 1 is the mean of the conversion and base lines. Lead line 2 is the 52-period lookback mean.
A long signal is generated when lead line 1 crosses over lead line 2. A short signal is generated on the cross under.
Advantage Analysis
The key advantage of this strategy is using the log-scale Ichimoku indicator better captures trend changes across cryptocurrencies. Percentage changes are more consistent in logarithmic space, resulting in more reliable trading signals.
Another advantage is that it facilitates cross-variety trading of cryptocurrencies. Using the log-Ichimoku improves comparability of price changes across different crypto varieties.
Risk Analysis
The main risk is that Ichimoku signals may fail. Particularly in volatile crypto markets, performance of Ichimoku can deteriorate.
Also, logarithmic transforms may fail during extreme moves. Comparability of logarithmic space decreases when prices make anomalous jumps.
Enhancement Opportunities
The strategy can be enhanced by:
Adding filters to confirm Ichimoku signals to reduce false signals
Updating optimal parameters more suited to crypto varieties
Adding pre-entry filters like volume to avoid false breakouts
Optimizing entry rules and adding stops and profit targets to control risk
Conclusion
This strategy utilizes the logarithmic Ichimoku indicator to design a quantitative strategy tailored to cryptocurrencies and cross-variety trading. While advantageous for capturing trends, it has risks. Further optimizations to parameters, filters and risk controls can enhance strategy performance.
/*backtest
start: 2024-01-22 00:00:00
end: 2024-02-21 00:00:00
period: 1h
basePeriod: 15m
exchanges: [{"eid":"Futures_Binance","currency":"BTC_USDT"}]
*/

//@version=3
strategy(title="Log Ichimoku Strategy", shorttitle="Ichi Strategy", overlay=true)

drop1st(src) =>
    x = na
    x := na(src[1]) ? na : src

conversionPeriods = input(9, minval=1, title="Conversion Line Periods"),
basePeriods = input(26, minval=1, title="Base Line Periods")
laggingSpan2Periods = input(52, minval=1, title="Lagging Span 2 Periods"),
displacement = input(26, minval=1, title="Displacement")
showClouds = input(false, "show clouds")

loglows = log(drop1st(low))
loghighs = log(drop1st(high))

donchian(len) =>
    avg(lowest(loglows, len), highest(loghighs, len))

conversionLine = donchian(conversionPeriods)
baseLine = donchian(basePeriods)
leadLine1 = avg(conversionLine, baseLine)
leadLine2 = donchian(laggingSpan2Periods)

plot(showClouds ? exp(conversionLine) : na, color=#0496ff, title="Conversion Line")
plot(showClouds ? exp(baseLine) : na, color=#991515, title="Base Line")

p1 = plot(showClouds ? exp(leadLine1) : na, offset = displacement, color=green, title="Lead 1")
p2 = plot(showClouds ? exp(leadLine2) : na, offset = displacement, color=red, title="Lead 2")
fill(p1, p2, color = showClouds ? (leadLine1 > leadLine2 ? green : red) : na)

if (crossover(leadLine1, leadLine2))
    strategy.entry("Ichi-LE", strategy.long, oca_name="Ichi", comment="Ichi")

if (crossunder(leadLine1, leadLine2))
    strategy.entry("Ichi-SE", strategy.short, oca_name="Ichi",  comment="Ichi")
- Dynamic Channel Moving Average Trend Tracking Strategy
- Harmonic Dual System Strategy
- Breakthrough Callback Long Strategy
- MA Crossover Trading Strategy Based on Short-term and Long-term Moving Average Crossovers
- Dual Moving Average Crossover MACD Quantitative Strategy
- Dual Moving Average Pressure Rebound Strategy
- Four WMA Trend Tracking Strategy
- Trend Following Strategy Based on Nadaraya-Watson Regression and ATR Channel
- Trend Tracking Strategy Based on Moving Average Crossover
- Trend Following Strategy Based on EMA Crossover
- Bitcoin Trading Strategy Based on RVI and EMA
- Bi-directional Reversal Quantitative Trading Strategy
- Bollinger Bands Consolidation Strategy
- Cloud-based Trend Strategy Using Ichimoku Cloud
- Trend Reversal Strategy Based on Moving Averages
- Trend Following Strategy Based on Renko Moving Average
- Three RSI Moving Average Bands Strategy
- Bidirectional Trading Strategy Based on Moon Phases
- Reversal Trading Strategy with EMA Crossover and Bollinger Bands
- Adaptive Moving Stop Line Trading Strategy