Trend Following Strategy Based on EMA Crossover
Author: ChaoZhang, Date: 2024-02-22 13:59:07Tags:

Overview
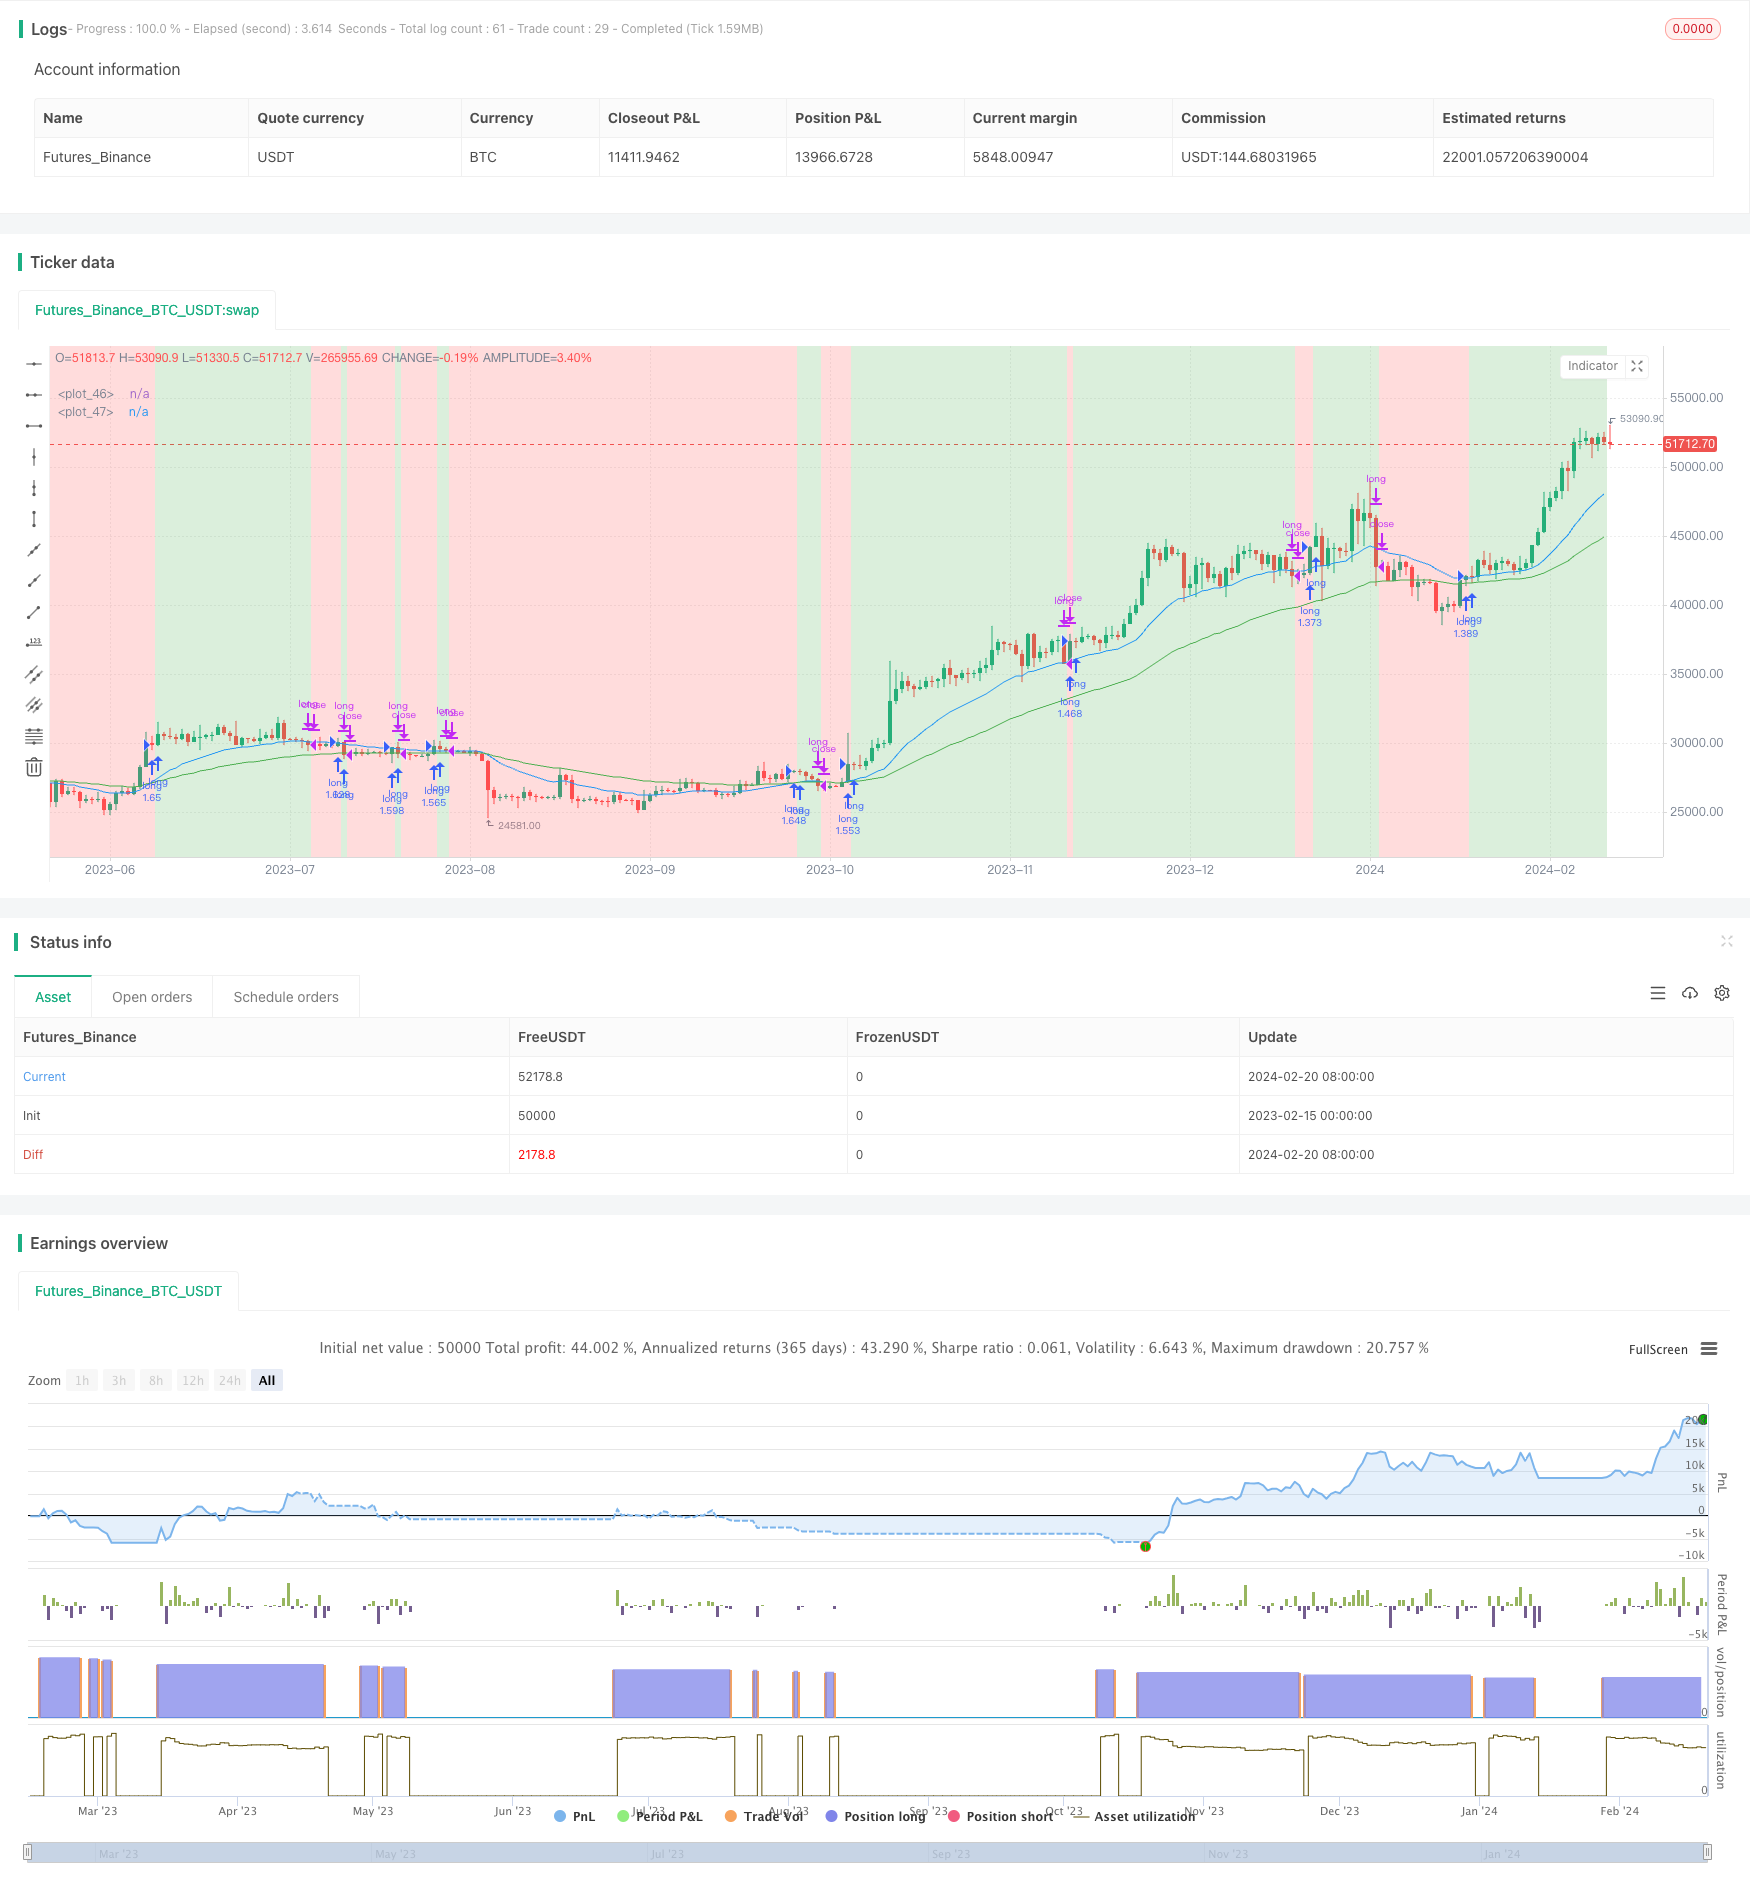
This strategy identifies market trend direction through the crossover of fast and slow EMA lines, and trades along the trend. It goes long when the fast EMA crosses above the slow EMA, and closes position when price breaks below the fast EMA.
Strategy Logic
The strategy calculates fast EMA (i_shortTerm) and slow EMA (i_longTerm) based on input parameters. When the short term EMA crosses above the long term EMA (goLongCondition1) and price is above the short term EMA (goLongCondition2), it enters long position. When price breaks below the short term EMA (exitCondition2), it closes position.
The strategy is based on the golden cross of EMA lines to determine the major market trend, and trade along the trend. When short term EMA crosses above long term EMA, it signals an uptrend; when price is above short term EMA, it indicates the uptrend is underway, so go long. When price drops below short term EMA, it signals a trend reversal, so close position immediately.
Advantage Analysis
The main advantages of this strategy are:
Utilize EMA crossover to identify major market trend, avoid short-term fluctuations.
Adjustable sensitivity in trend detection via fast and slow EMA parameters.
Simple and clear logic, easy to understand and implement, suitable for quant trading beginners.
Customizable EMA period parameters for different products and markets.
Effective risk control by stop loss when price breaks EMA line.
Risk Analysis
There are also some risks:
Delayed EMA crossover signals may cause losses during trend reversal.
False breakout above short term EMA may cause failed entries.
Improper paramedic parameter settings may undermine strategy performance.
Performance relies heavily on market condition, not suitable for all products and periods.
The corresponding risk management measurements:
Optimize EMA parameters for better sensitivity on reversals.
Add other technical indicators to filter entry signals.
Continuously debug and optimize parameters for different markets.
Fully understand applicable market conditions before applying strategy.
Optimization Directions
The strategy can be further optimized in the following aspects:
Add other indicators like MACD and KD to filter entry signals.
Implement trailing stop loss to lock profit and better risk control.
Optimize stop loss placement with volatility indicator ATR.
Test and find better scientific methods for EMA parameter tuning.
Validate signals on multiple timeframes to improve accuracy.
Try BREAKOUT modifications to catch larger moves during trend acceleration stages.
Conclusion
This strategy effectively tracks market trend by trading on EMA crossover signals. With clear logic and controllable risks, it is suitable for quant trading beginners to practice on. Further optimizations on parameter tuning, entry filtering, stop loss placement can improve strategy performance. But all strategies have limitations, users should apply cautiously based on market conditions when live trading.
/*backtest
start: 2023-02-15 00:00:00
end: 2024-02-21 00:00:00
period: 1d
basePeriod: 1h
exchanges: [{"eid":"Futures_Binance","currency":"BTC_USDT"}]
*/

// This Pine Script™ code is subject to the terms of the Mozilla Public License 2.0 at https://mozilla.org/MPL/2.0/
// © pradhan_abhishek

//@version=5
strategy('EMA cross-over strategy by AP', overlay=true, shorttitle='EMACS-AP', initial_capital=100000, default_qty_value=100, default_qty_type=strategy.percent_of_equity, commission_value=0.025)

// inputs
i_shortTerm = input(title='Fast EMA', defval=21)
i_longTerm = input(title='Slow EMA', defval=55)
// select backtest range: if this is not given, then tradingview goes back since inception / whereever it finds data
i_from = input(defval = timestamp("01 Jan 2023 00:00"), title = "From")
i_to = input(defval = timestamp("31 Dec 2033 23:59"), title = "To")
i_showBg = input(defval = true, title = "Show In-trade / Out-trade background")

// create date function "within window of time"
date() => true

// exponential moving average (EMA) variables, derived from input parameters
shortTermEMA = ta.ema(close, i_shortTerm)
longTermEMA = ta.ema(close, i_longTerm)
atr = ta.atr(14)

// ### Trade strategy: begins ###
inTrade = strategy.position_size > 0
notInTrade = strategy.position_size <= 0

goLongCondition1 = shortTermEMA > longTermEMA
goLongCondition2 = close > shortTermEMA

// exitCondition1 = shortTermEMA < midTermEMA
exitCondition2 = close < shortTermEMA

// enter if not in trade and long conditions are met
if date() and goLongCondition1 and goLongCondition2 and notInTrade
    strategy.entry('long', strategy.long)
    // exit on stop-Loss hit
    stopLoss = close - atr * 3
    strategy.exit('exit', 'long', stop=stopLoss)

// exit if already in trade and take profit conditions are met
if date() and exitCondition2 and inTrade
    strategy.close(id='long')
// ###Trade strategy: ends ###

// plot emas & background color for trade status
plot(shortTermEMA, color=color.new(color.blue, 0))
plot(longTermEMA, color=color.new(color.green, 0))
trade_bgcolor = notInTrade ? color.new(color.red, 75) : color.new(color.green, 75)
bgcolor(i_showBg ? trade_bgcolor : color.new(color.white, 75))
- Nifty 50 Quantitative Trading Strategy Based on Dynamic Position Adjustment with Support and Resistance Levels
- Dynamic Channel Moving Average Trend Tracking Strategy
- Harmonic Dual System Strategy
- Breakthrough Callback Long Strategy
- MA Crossover Trading Strategy Based on Short-term and Long-term Moving Average Crossovers
- Dual Moving Average Crossover MACD Quantitative Strategy
- Dual Moving Average Pressure Rebound Strategy
- Four WMA Trend Tracking Strategy
- Trend Following Strategy Based on Nadaraya-Watson Regression and ATR Channel
- Trend Tracking Strategy Based on Moving Average Crossover
- Log Ichimoku Cross Variety Strategy
- Bitcoin Trading Strategy Based on RVI and EMA
- Bi-directional Reversal Quantitative Trading Strategy
- Bollinger Bands Consolidation Strategy
- Cloud-based Trend Strategy Using Ichimoku Cloud
- Trend Reversal Strategy Based on Moving Averages
- Trend Following Strategy Based on Renko Moving Average
- Three RSI Moving Average Bands Strategy
- Bidirectional Trading Strategy Based on Moon Phases
- Reversal Trading Strategy with EMA Crossover and Bollinger Bands