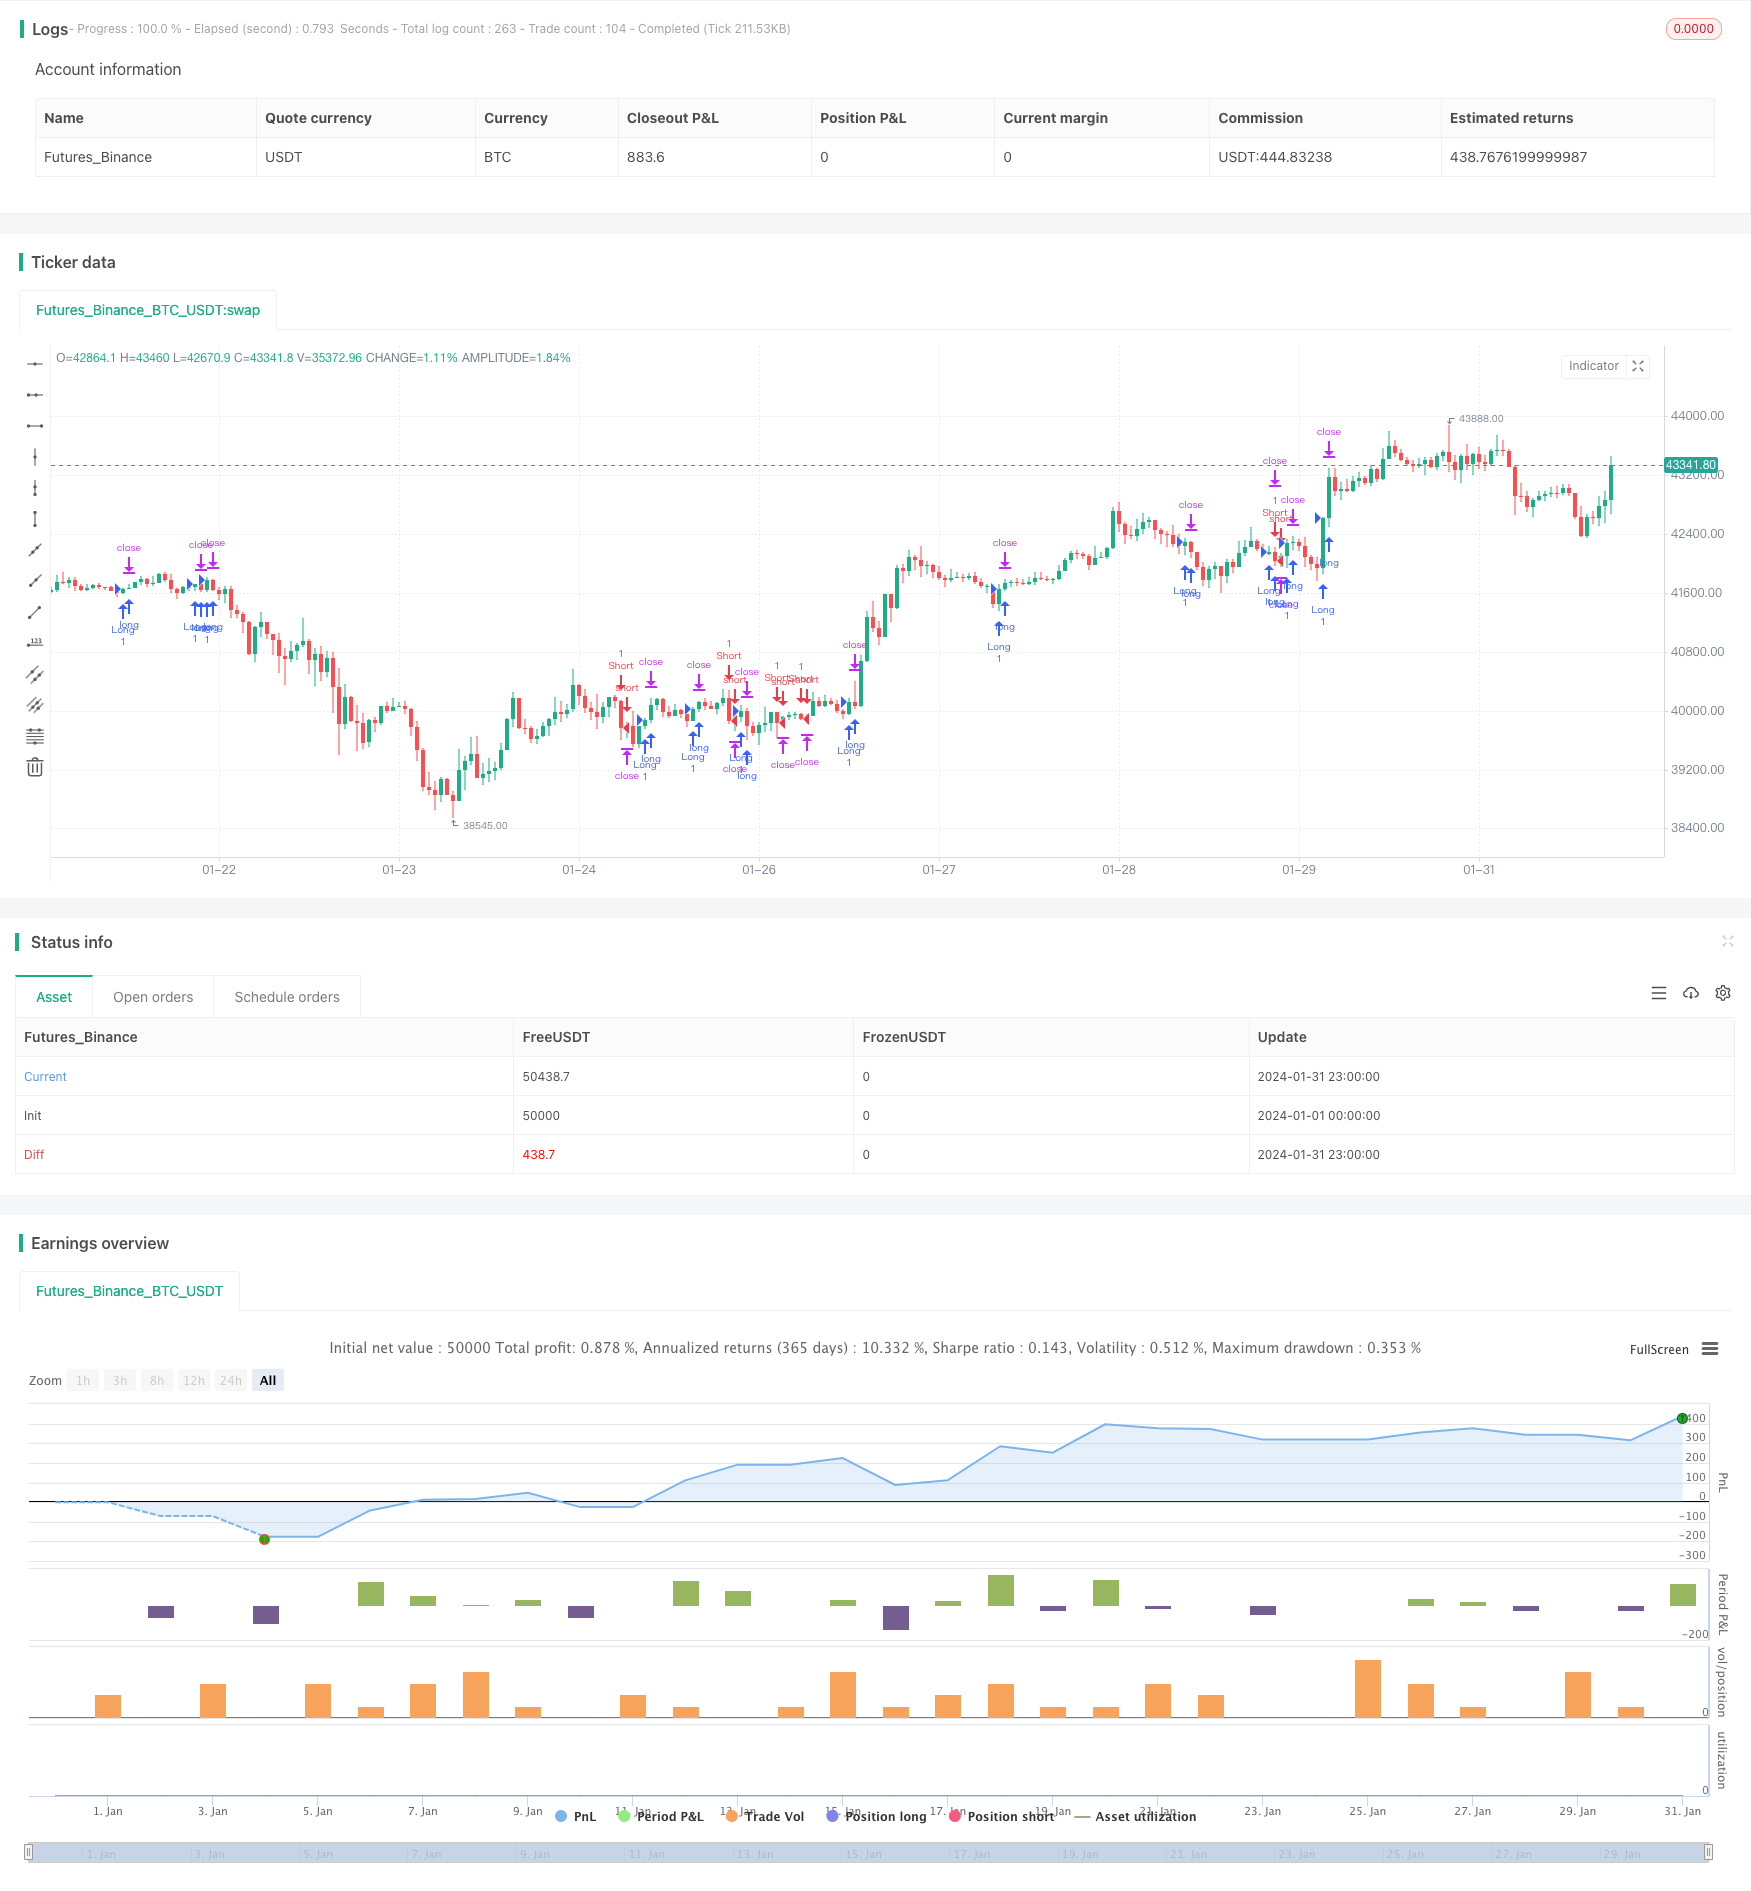
Overview
The core of this strategy is to identify trend direction and entry timing using the EMA and MACD indicators. When price breaks through the EMA, it is considered that the trend has changed, and the MACD divergence indicator further confirms the trend signal. The timing of buys and sells can be determined based on the relationship between price and EMA and MACD.
Strategy Principle
This strategy mainly relies on the 20-period EMA line and the MACD indicator to determine trend direction. The specific trading signal generation rules are as follows:
Buy signal: When the price is below the 20EMA and the MACD indicator line is below the 0 axis, wait for the price to break upwards across the 20EMA, while checking if the MACD indicator line has turned from negative to positive at the same time or has just turned from negative to positive. If the criteria are met, a buy signal is issued at a price 10 ticks above the 20EMA.
Sell signal: When the price is above the 20EMA and the MACD indicator line is above the 0 axis, wait for the price to break downwards across the 20EMA, while checking if the MACD indicator line has turned from positive to negative at the same time or has just turned from positive to negative. If the criteria are met, a sell signal is issued at a price 10 ticks below the 20EMA.
This strategy combines trend judgment and indicator filtering to effectively identify trend change points and avoid false signals in consolidation zones.
Advantage Analysis
The biggest advantage of this strategy is that while using the EMA to judge the major trend direction, the MACD indicator is also used for double confirmation, which filters out some noisy trading signals. The EMA line can better determine the main trend direction, while the MACD can further determine whether it is brewing. Therefore, this combination filter method makes the strategy signal more reliable.
On the other hand, the strategy also provides a risk control mechanism. By adopting fixed stop loss and take profit, risks can be controlled effectively. In addition, some of the positions cater to risk-off, while the other part attempts to follow the trend for profit. This balances risk and return.
Risk Analysis
The biggest risk of this strategy is that the trend signals judged by the EMA and MACD may not be completely reliable. Prices may reverse to some extent, causing the stop loss to be triggered. False signals may also occur during consolidation. This needs to be avoided as much as possible through parameter optimization.
On the other hand, fixed stop loss and take profit settings also carry certain risks. When the market sees dramatic fluctuations, the fixed value of stop loss and take profit may not fully adapt to the market, which is prone to being trapped or exiting prematurely. This requires adjusting the stop loss and take profit parameters according to the volatility and liquidity at that time.
Optimization Directions
The strategy can be optimized in the following ways:
Test different parameter periods for the EMA to find the optimal parameter combination
Optimize the parameters of the MACD to make it more suited to the characteristics of the trading variety
Try changing the settings of stop loss and take profit, such as using ATR stop loss, etc.
Add other indicators for signal filtering to improve signal quality
Evaluate trading performance across different varieties and select the best fit
Through parameter and model optimization, the stability and profitability of the strategy can be further improved. At the same time, the risk of overfitting in the optimization process needs to be controlled.
Summary
Overall, this strategy is quite robust, using double indicator combined judgment to filter noisy trades to some extent. Risk control is also adequate. Through further optimization of parameters and models, this strategy can become a worthwhile quantitative trading strategy to verify in live trading.
/*backtest
start: 2024-01-01 00:00:00
end: 2024-01-31 23:59:59
period: 1h
basePeriod: 15m
exchanges: [{"eid":"Futures_Binance","currency":"BTC_USDT"}]
*/

//@version=4
strategy("EMA and MACD Trading Strategy", overlay=true)

// Define inputs
emaPeriod = input(20, title="EMA Period")
macdShort = input(12, title="MACD Short Period")
macdLong = input(26, title="MACD Long Period")
macdSignal = input(9, title="MACD Signal Period")
riskAmount = input(10, title="Risk Amount (in pips)")

// Calculate indicators
ema = ema(close, emaPeriod)
[macdLine, signalLine, _] = macd(close, macdShort, macdLong, macdSignal)

// Define long trade conditions
longCondition = crossover(close, ema) and (macdLine > 0 or crossover(macdLine, signalLine)) // Removed unnecessary argument

// Define short trade conditions
shortCondition = crossunder(close, ema) and (macdLine < 0 or crossunder(macdLine, signalLine)) // Removed unnecessary argument

// Execute long trade
if (longCondition)
    stopLoss = close - riskAmount
    takeProfit = close + riskAmount
    strategy.entry("Long", strategy.long)
    strategy.exit("Exit", "Long", stop=stopLoss, limit=takeProfit)

// Execute short trade
if (shortCondition)
    stopLoss = close + riskAmount
    takeProfit = close - riskAmount
    strategy.entry("Short", strategy.short)
    strategy.exit("Exit", "Short", stop=stopLoss, limit=takeProfit)