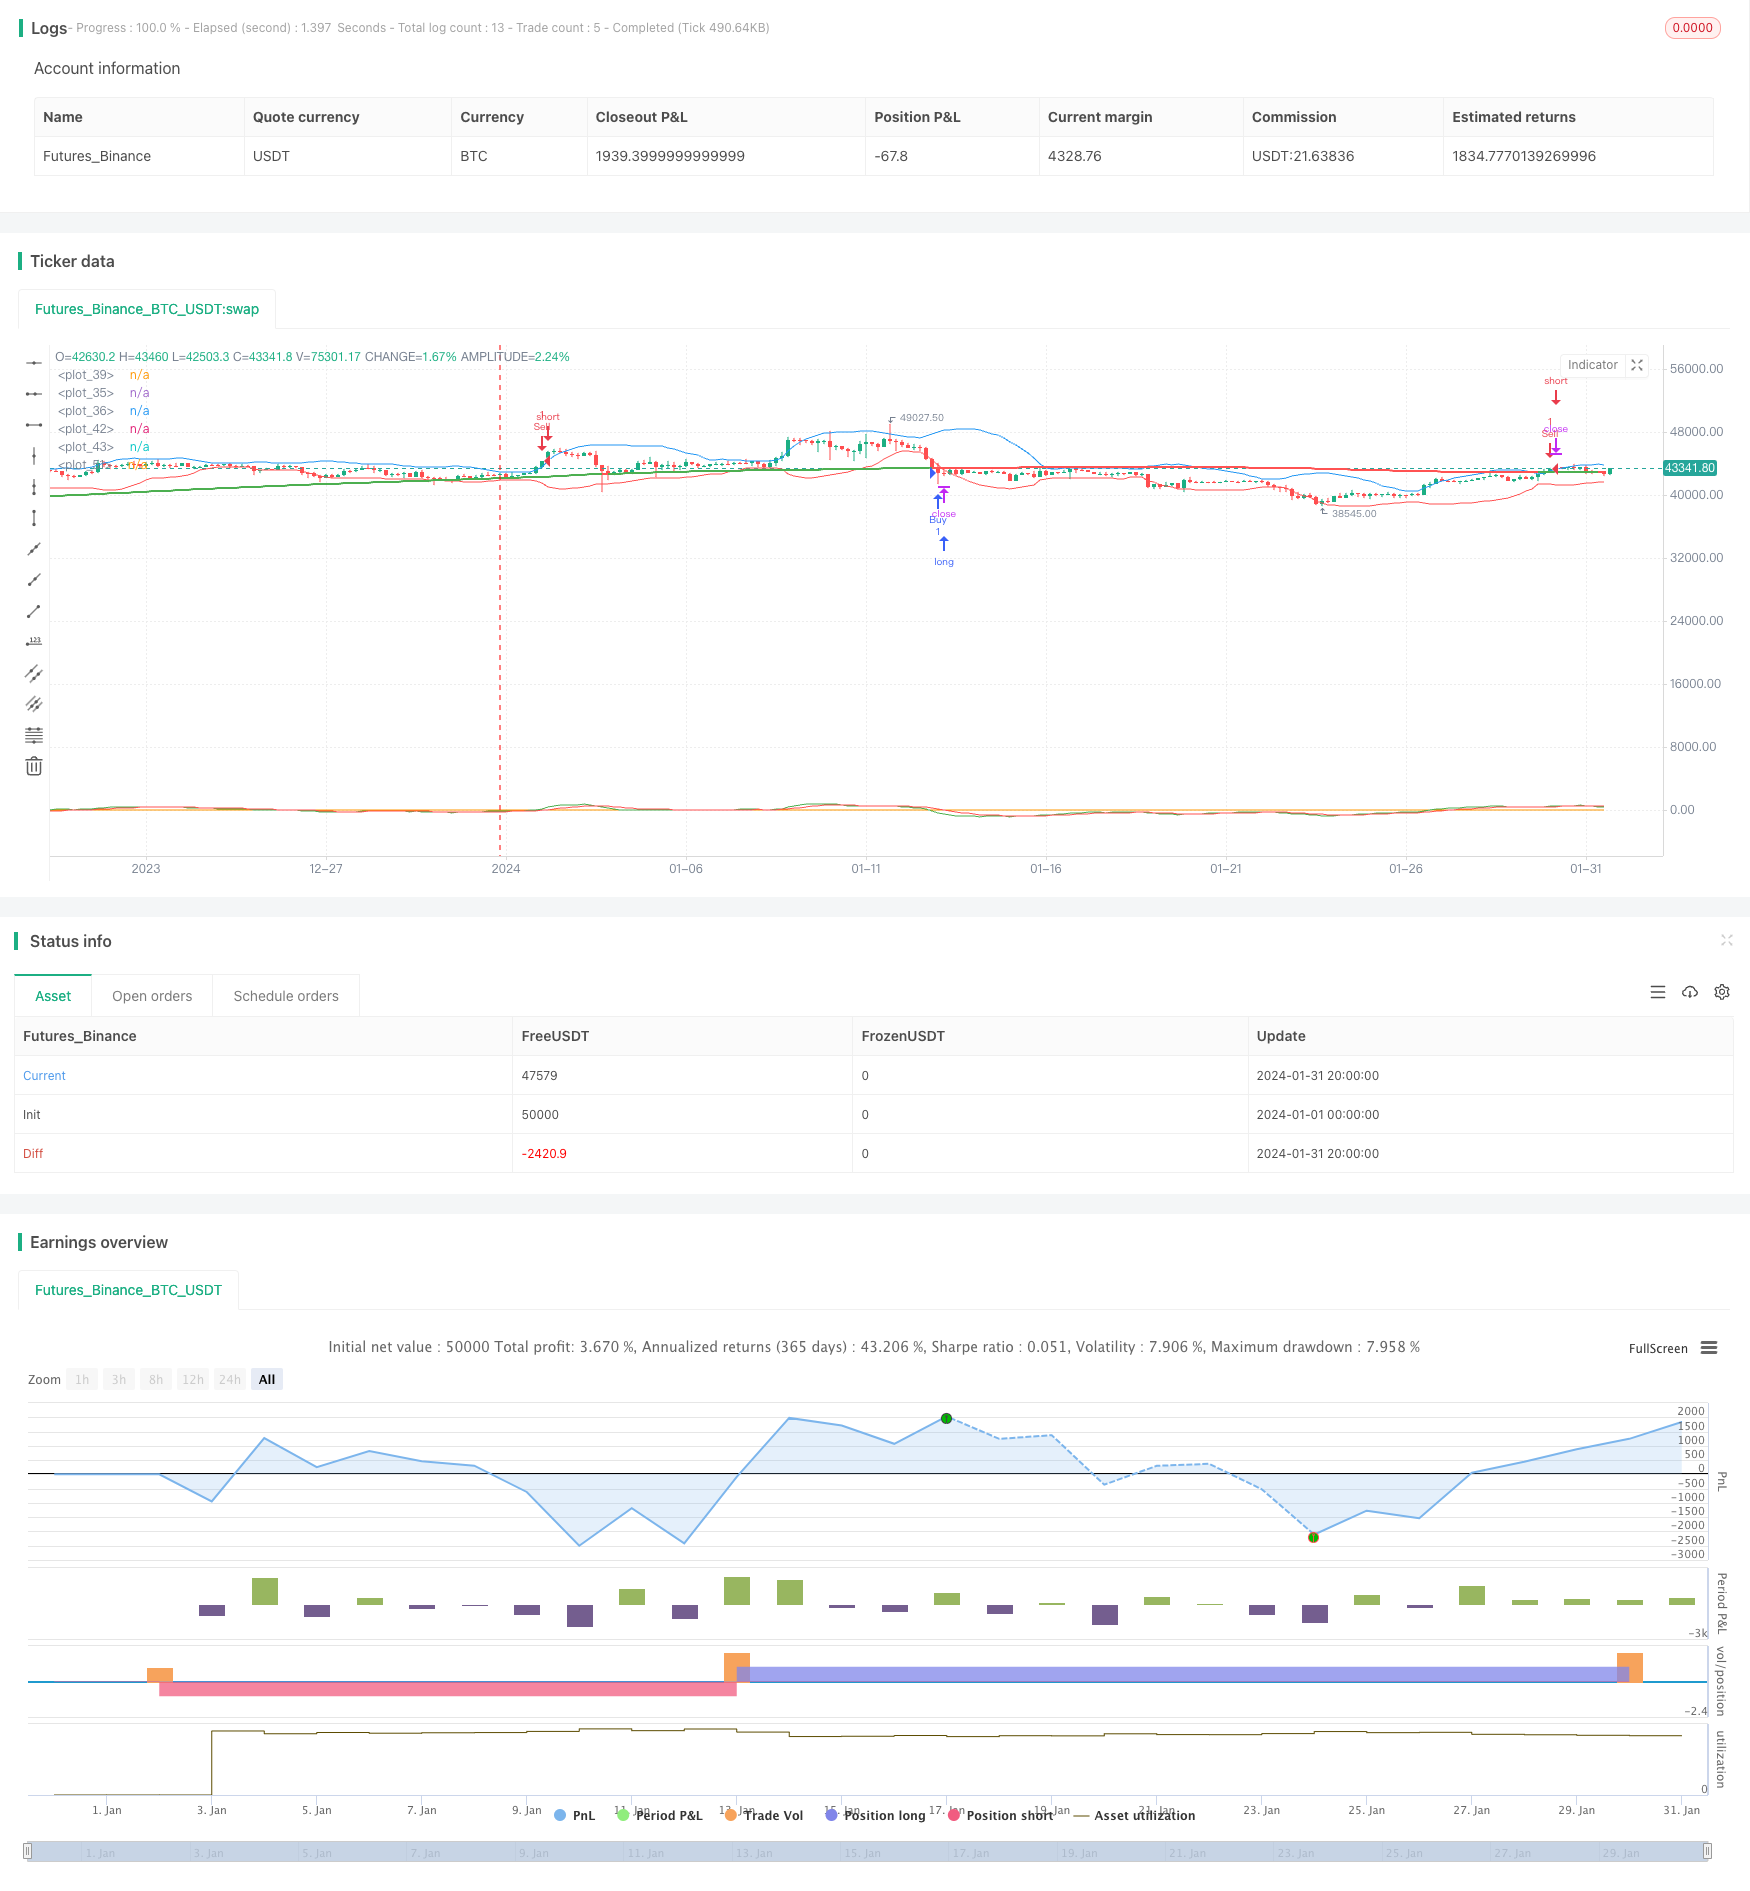
Overview
This strategy is a typical quant strategy that tracks market trends. It mainly uses Bollinger Bands, RSI indicator and MACD indicator to judge the overbought and oversold situation of the market and make reverse trades. When overbought signals appear, the strategy makes profits by shorting; when oversold signals appear, it makes profits by going long following the trend.
Strategy Principles
The strategy mainly uses three indicators for judgement.
Firstly, it uses the upper and lower rails of Bollinger Bands to determine if the price has entered the overbought or oversold zone. Specifically, if the price is higher than the upper rail, the market may be overbought; if the price is lower than the lower rail, the market may be oversold.
Secondly, the strategy uses the RSI indicator to determine the overbought and oversold condition of the market. RSI below 30 is considered as oversold signal; RSI above 70 is considered as overbought signal.
Finally, the strategy also uses MACD zero line crossovers as an auxiliary judgement. When MACD line crosses signal line from top to bottom, a sell signal is generated; when MACD line crosses signal line from bottom to top, a buy signal is generated.
By combining the judgements of these three indicators, the strategy can effectively capture the timing of market reversal, make reverse entries accordingly, and profit along the major trend.
Advantage Analysis
The biggest advantage of this strategy lies in combining multiple indicators to determine market trends, which enhances the correctness of decisions.
Firstly, Bollinger Bands itself has very strong trend judging capability. It is combined with Bollinger Bands channel to determine whether the price has entered the overbought or oversold zone.
Secondly, RSI is a very typical reversal indicator. The overbought and oversold threshold settings of RSI indicator also enhance the accuracy of judgement.
Finally, MACD zero line crossover is a very classic indicator for determining buy and sell points. Combined with MACD zero line cross signals, reversal points can be determined very accurately.
In summary, by effectively combining multiple indicators, the judgment of this strategy is more accurate and the win rate is higher than single indicator strategies, thereby obtaining stable excess returns.
Risk Analysis
Although the strategy is reasonably designed with combined multiple indicators, there are still some risks to be aware of.
Firstly, if the market experiences prolonged one-way moves without obvious reversals, this strategy would generate more losing trades. We need to temporarily exit and wait for reversal opportunities in such case.
Secondly, the parameter settings of RSI and MACD need to be carefully tested according to different markets. If the parameters are improperly set, it may also lead to wrong signals and losses.
Finally, Bollinger Bands itself is also quite sensitive to abnormal fluctuations. When the market experiences low-frequency violent swings, Bollinger Bands signals need to be interpreted cautiously.
In general, this strategy is mainly suitable for markets with high volatility and obvious reversals. In terms of risk management, we can set stop loss to control maximum losses; in addition, optimizing parameters to adapt to different market environments is also very important.
Optimization Directions
The strategy can be further optimized in the following aspects:
Optimize Bollinger Band parameters to make the BB channel closer to the market volatility range. Different period lengths and standard deviation multiples can be tested to find the optimal parameter combination.
Optimize RSI parameters and adjust overbought/oversold thresholds to reduce false signals. The best parameter settings can be found through backtesting.
Optimize MACD parameters to find the optimal fast line, slow line and signal line combinations to improve the accuracy of MACD zero line crossovers.
Add stop loss strategy to limit single loss percentage and effectively control risks.
Add position management strategy to dynamically adjust position size, leverage based on market volatility.
Combine other indicators and trading signals to improve decision accuracy. For example, combine trading volume abnormals etc.
Through methods like parameter optimization, risk control, signal fusion, the stability and profitability of this strategy can be further improved.
Conclusion
The Reversal Bollinger Band RSI MACD Quant Strategy effectively utilizes the crossover judgements of Bollinger Bands, RSI and MACD to determine potential market reversal timings, and makes reverse trades accordingly along the major trend. Compared to single indicator strategies, the combined strategy has more accurate judgement and higher winning rate, able to obtain relatively stable excess returns. Of course in actual usage, factors like market environment, parameter optimization, risk control etc. need to be considered comprehensively to improve the robustness of the strategy.
/*backtest
start: 2024-01-01 00:00:00
end: 2024-01-31 23:59:59
period: 4h
basePeriod: 15m
exchanges: [{"eid":"Futures_Binance","currency":"BTC_USDT"}]
*/

//@version=4
strategy("BBands + RSI + MACD Strategy", overlay=true)

// Bollinger Bands
lengthBB = input(20, title="BB Length")
multBB = input(2.0, title="BB Standard Deviation")
basis = sma(close, lengthBB)
dev = multBB * stdev(close, lengthBB)
upperBB = basis + dev
lowerBB = basis - dev

// RSI
lengthRSI = input(14, title="RSI Length")
oversold = input(30, title="Oversold Threshold")
overbought = input(70, title="Overbought Threshold")
rsi = rsi(close, lengthRSI)

// MACD
fastLength = input(12, title="MACD Fast Length")
slowLength = input(26, title="MACD Slow Length")
signalLength = input(9, title="MACD Signal Smoothing")
[macdLine, signalLine, _] = macd(close, fastLength, slowLength, signalLength)

// Conditions
longCondition = close < lowerBB and rsi < oversold and macdLine < signalLine
shortCondition = close > upperBB and rsi > overbought and macdLine > signalLine

// Strategy Entry and Exit
if (longCondition)
    strategy.entry("Buy", strategy.long)
if (shortCondition)
    strategy.entry("Sell", strategy.short)

// Plotting Bollinger Bands
plot(upperBB, color=color.blue)
plot(lowerBB, color=color.red)

// Plotting RSI
plot(rsi, color=color.orange)

// Plotting MACD
plot(macdLine, color=color.green)
plot(signalLine, color=color.red)


// 200-period SMA
sma200 = sma(close, 200)

// Determine Color Change
plot(sma200, color=close > sma200 ? color.green : color.red, linewidth=2)