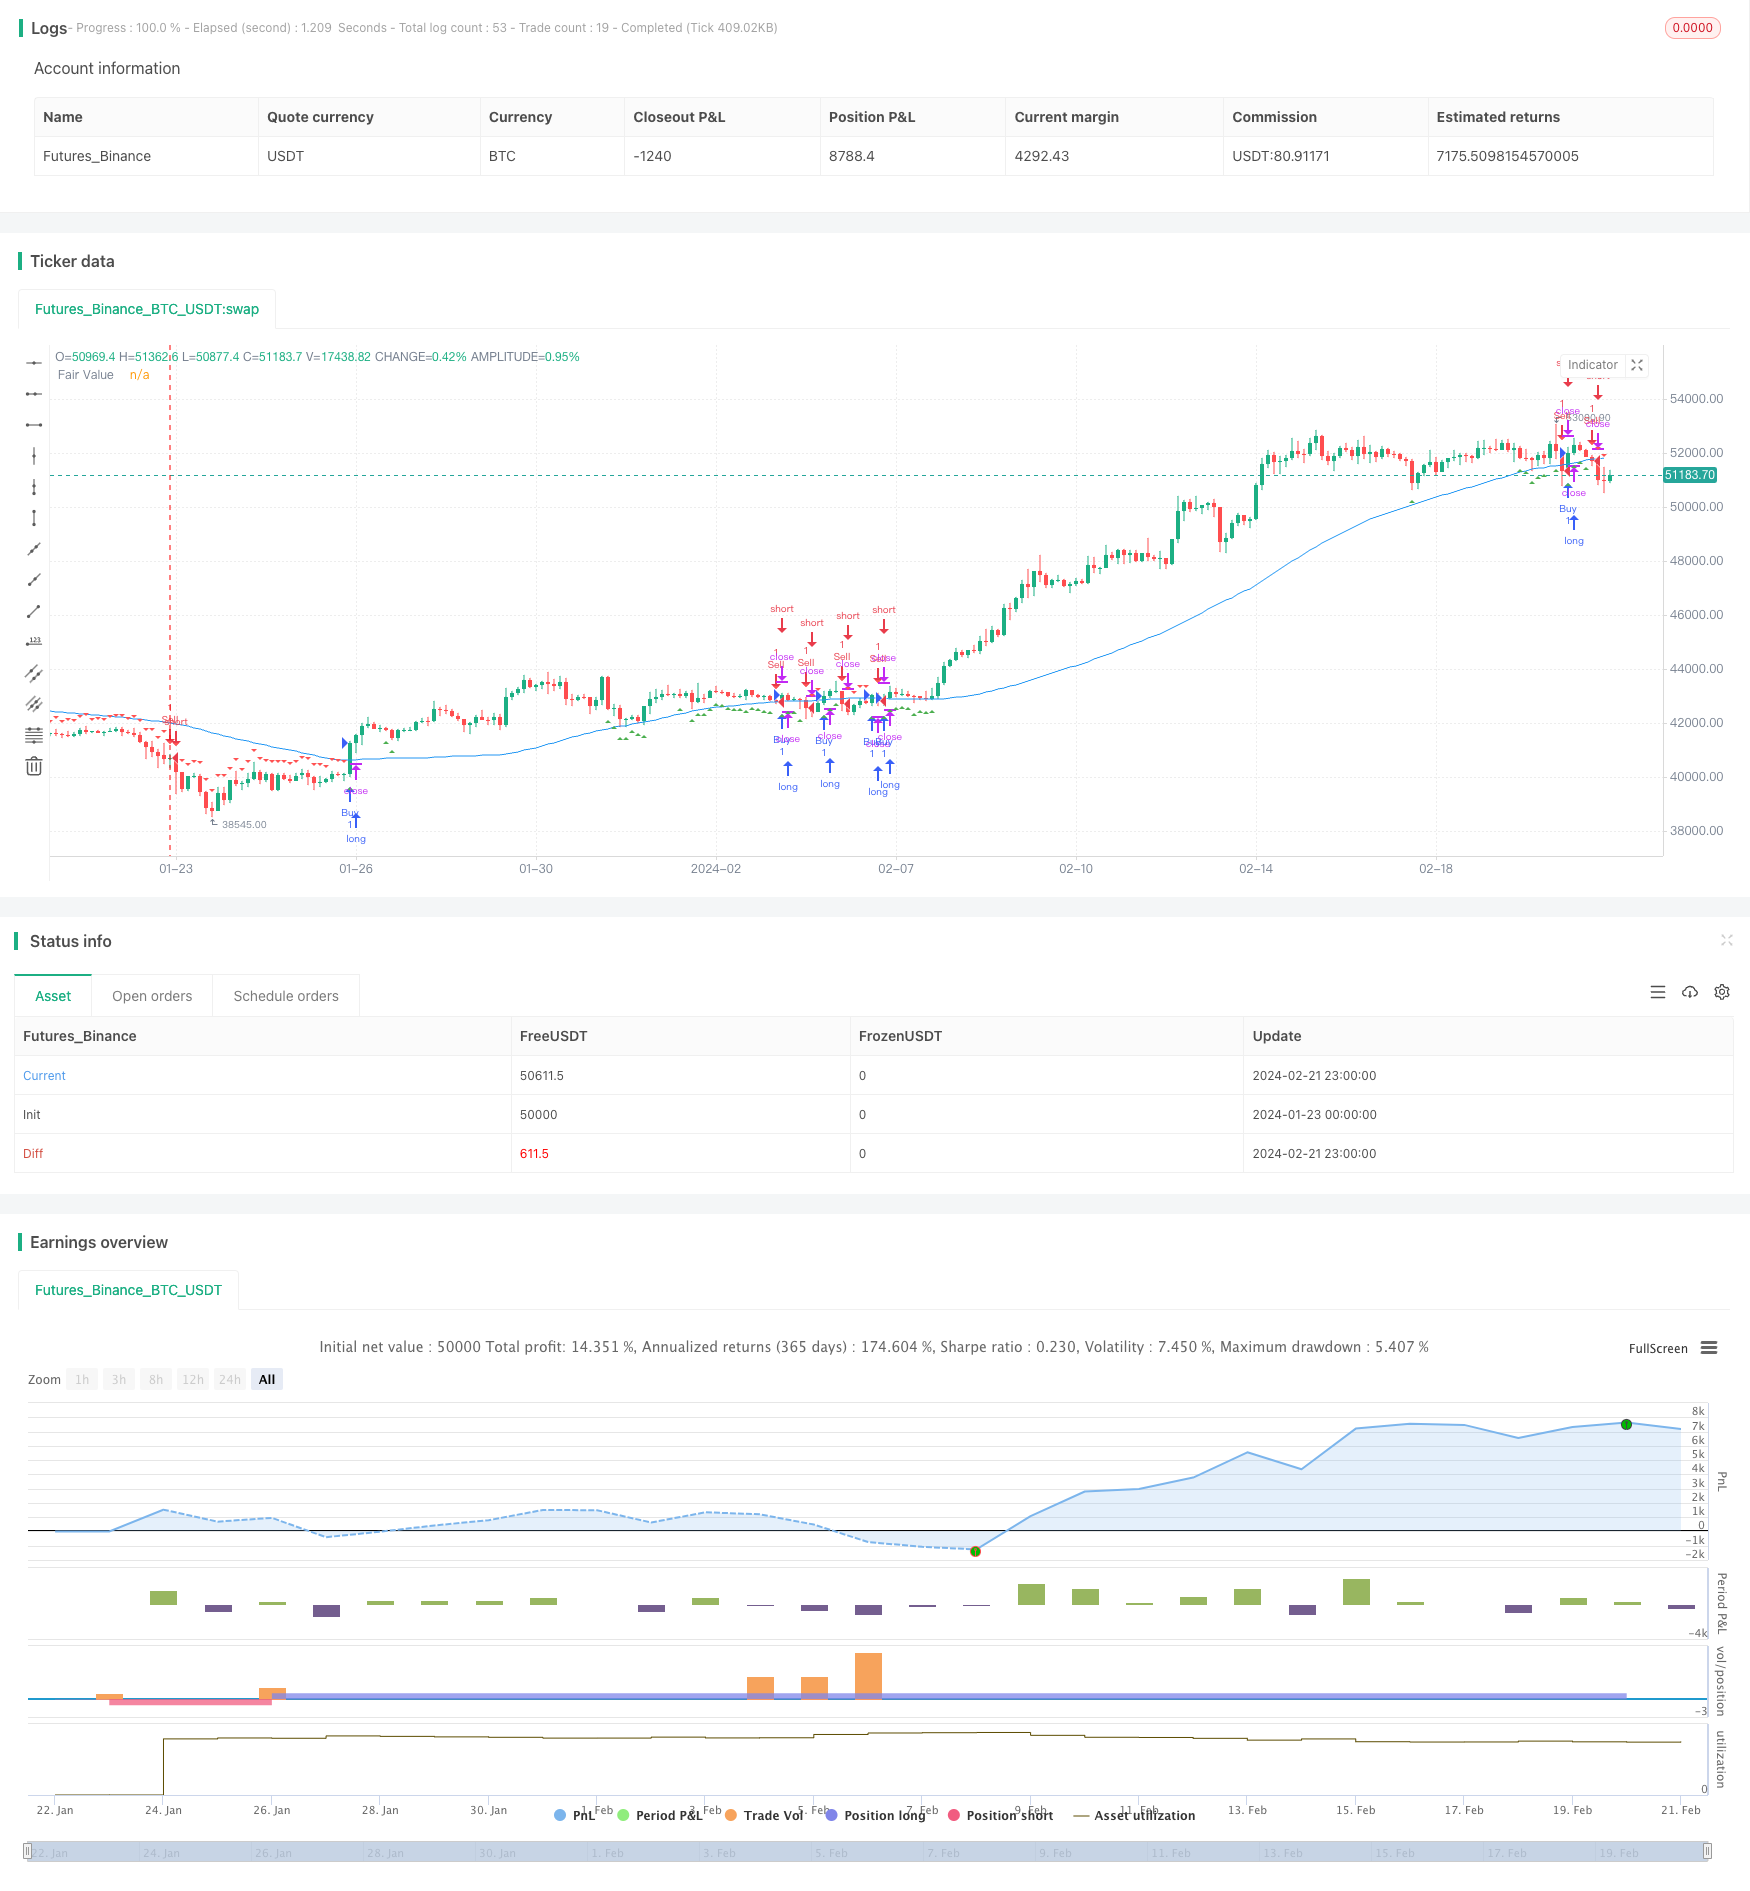
Overview
This strategy is named the “Institutional Trader Strategy Based on Price Action”. It attempts to take advantage of certain trading patterns used by institutional traders, particularly their tendency to place orders around specific “order blocks”. The strategy incorporates elements of fair value, liquidity, and price action to determine entries and exits from the market.
Strategy Logic
The core of the strategy is identifying “order blocks” – price areas where significant institutional trading activity has taken place in the past. These areas are associated with significant liquidity. Order blocks are determined using price structures and are often associated with key technical price levels.
Fair value is defined as the “reasonable” price of a tool based on indicators like moving averages. When the current price moves far from fair value, this is seen as a signal of market imbalance.
Liquidity is also a key factor as institutional traders tend to execute trades in high liquidity areas.
The strategy determines fair value by calculating a simple moving average. It then identifies potential order blocks of length 20 periods. If the difference between the close price and fair value is below 38.2% of the total height of the order block range, an order block is determined.
Bullish order blocks are considered buy signals. Bearish order blocks are considered sell signals.
Advantage Analysis
The main advantages of the strategy are using the trading patterns of institutional traders which may allow it to outperform more mechanistic indicator-based strategies. By watching order flow and value areas, it combines several different types of analysis.
Other advantages include:
- Getting better execution using liquidity
- Relying on easy to visualize concepts like order flow
- Easy to visualize order blocks on charts
- Flexibility to adjust parameters like block length
Risk Analysis
The strategy also faces some potential risks such as:
- Reliance on judgments about past price behavior
- May not function properly in markets without order flow
- Could produce false signals
- Could miss short-term trends
To mitigate these risks, it’s recommended to consider:
- Combining with other indicators to filter false signals
- Adjusting parameters like block length
- Filtering the signals issued for trading
Optimization Directions
Here are some potential optimizations for the strategy:
- Test and optimize key parameter values like block length and fair value deviation percentage
- Add additional indicators and filters to improve quality
- Build in stop loss and take profit mechanisms
- Incorporate more data sources like order book activity
- Test robustness across different periods (intraday, multi-day etc) and markets
- Add machine learning predictions to filter signals
Summary
In summary, the strategy offers a unique approach to take advantage of institutional trader behavior. It blends multiple elements and has certain advantages. But like most trading strategies, it also faces risks when market conditions change or unexpected price behavior occurs. With continual testing, optimization, and risk management, the strategy can become a valuable quantitative trading tool.
/*backtest
start: 2024-01-23 00:00:00
end: 2024-02-22 00:00:00
period: 3h
basePeriod: 15m
exchanges: [{"eid":"Futures_Binance","currency":"BTC_USDT"}]
*/

//@version=5
strategy("ICT Strategy", overlay=true)

// Input variables
length = input.int(20, minval=1, title="Order Block Length")
fairValuePeriod = input.int(60, minval=1, title="Fair Value Period")

// Calculate fair value
fairValue = ta.sma(close, fairValuePeriod)

// Determine order blocks
isOrderBlock(high, low) =>
    highestHigh = ta.highest(high, length)
    lowestLow = ta.lowest(low, length)
    absHighLowDiff = highestHigh - lowestLow
    absCloseFairValueDiff = (close - fairValue)
    (absCloseFairValueDiff <= 0.382 * absHighLowDiff)

isBuyBlock = isOrderBlock(high, low) and close > fairValue
isSellBlock = isOrderBlock(high, low) and close < fairValue

// Plot fair value and order blocks
plot(fairValue, color=color.blue, title="Fair Value")
plotshape(isBuyBlock, style=shape.triangleup, location=location.belowbar, color=color.green, size=size.small)
plotshape(isSellBlock, style=shape.triangledown, location=location.abovebar, color=color.red, size=size.small)

// Strategy logic
if (isBuyBlock)
    strategy.entry("Buy", strategy.long)

if (isSellBlock)
    strategy.entry("Sell", strategy.short)