Overview
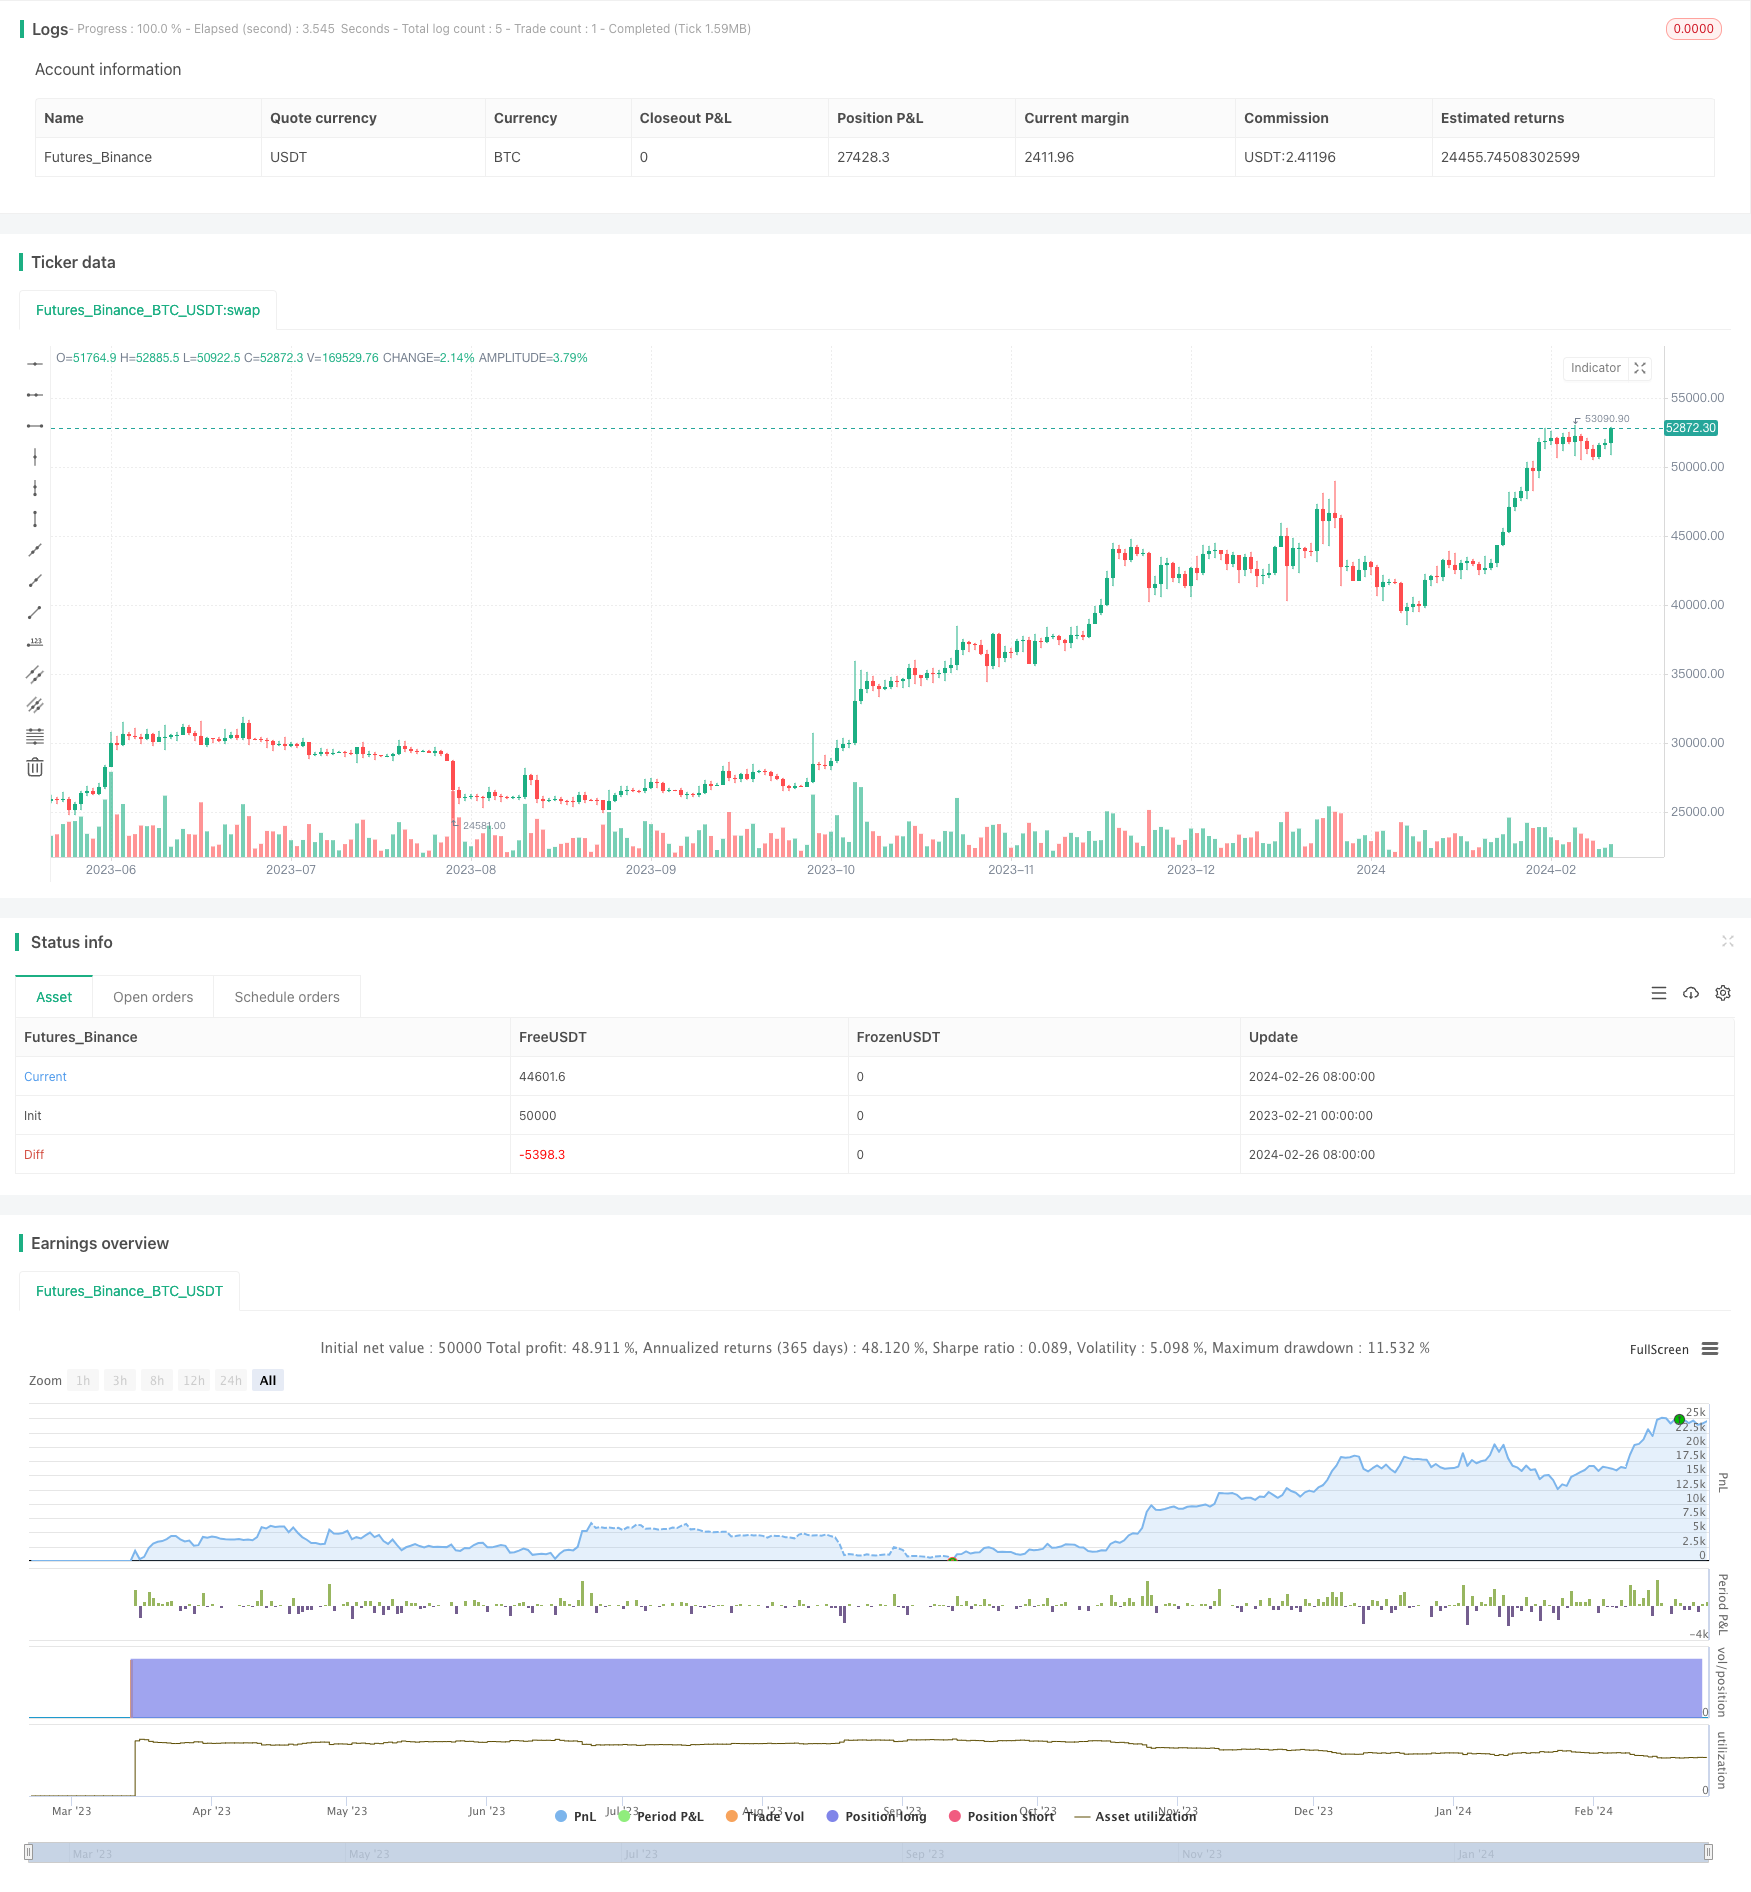
This strategy combines the trend of prices, the momentum of trading volume and the volatility of price fluctuations to generate buy and sell signals. The main idea is to buy in an upwards price trend and amplified price volatility market environment and sell in a downwards price trend and contracted price volatility market environment, in order to profit by capturing price trends and utilizing price fluctuations.
Strategy Principle
The strategy uses the following three key indicators:
Trend Indicator: Simple Moving Average (SMA). This indicator calculates the average price over a “Trend Period” defined by user to evaluate the price trend.
Momentum Indicator: Volume Weighted Moving Average (VWMA). This indicator considers trading volume and calculates a weighted moving average of prices to show price momentum based on a “Momentum Period” defined by user.
Volatility Indicator: Bollinger Bands. This indicator contains three lines: upper band, middle band and lower band. The width of bands is determined by the “Bollinger Bands Period” and “Bollinger Bands Deviation” parameters defined by user.
The buy signal is generated when the price crosses above the trend indicator SMA and the price is above the upper Bollinger band. The sell signal is generated when the price crosses below the trend indicator SMA and the price is below the lower Bollinger band.
Advantage Analysis
This strategy comprehensively considers multiple market indicators, which can effectively determine the market trend. Using trend indicators to determine the direction of price trends, using momentum indicators to determine the strength and speed, and using volatility indicators to determine opportunities. Compared with a single indicator, this combined indicator can more fully grasp the market, avoid wrong signals, and thereby improve the accuracy of decisions.
Risk Analysis
The biggest risk of this strategy is the improper indicator settings. If the trend cycle parameter is set too short, it is prone to generate wrong signals. If Bollinger Bands parameters set too wide or too narrow, it will also affect judgment. In addition, emergencies may also cause prices to fluctuate sharply and cause unexpected losses. So we need to fully test the stability of parameters and control position size and stop loss point.
Optimization Directions
The strategy can be optimized in the following directions:
Optimize indicator parameters to find the optimal parameter combination through historical backtesting and parameter scanning.
Increase stop loss mechanism. Force CLOSE orders when price breaks through the stop loss line to effectively control single loss.
Incorporate other indicators such as Energy Wave indicator, Relative Strength Index etc. to improve decision accuracy.
Develop dynamic position management mechanisms. Appropriately reduce positions when market uncertainty is high and appropriately increase positions when signals are clearer.
Summary
The strategy integrates multiple indicators to judge the trend, which can improve the accuracy of decisions in theory. But the key lies in the selection and adjustment of indicator parameters, which requires sufficient testing to find the optimal parameters. At the same time, attention should be paid to risk control and prevention of the impact of emergencies. If continuously optimized and improved, the strategy can become a stable and reliable quantitative trading strategy.
/*backtest
start: 2023-02-21 00:00:00
end: 2024-02-27 00:00:00
period: 1d
basePeriod: 1h
exchanges: [{"eid":"Futures_Binance","currency":"BTC_USDT"}]
*/

//@version=4
strategy("Trend, Momentum ve Volatilite Stratejisi", overlay=true)

// Kullanıcı tarafından ayarlanabilir girdilerin panelde görüntülenmesi
trendPeriod = input(50, "Trend Periyodu")
momentumPeriod = input(14, "Momentum Periyodu")
bbPeriod = input(20, "Bollinger Bantları Periyodu")
bbDeviation = input(2, "Bollinger Bantları Sapması")

// Fiyat hareketlerine dayalı trend göstergesi (Örneğin: Basit Hareketli Ortalama)
trendIndicator = sma(close, trendPeriod)

// Hacim tabanlı momentum göstergesi (Örneğin: Hacim Ağırlıklı Ortalama Fiyat)
momentumIndicator = vwma(close, momentumPeriod)

// Volatilite göstergesi (Bollinger Bantları)
[upperBB, middleBB, lowerBB] = bb(close, bbPeriod, bbDeviation)

// Alım ve satım sinyallerinin belirlenmesi
buySignal = crossover(close, trendIndicator) and close > upperBB
sellSignal = crossunder(close, trendIndicator) and close < lowerBB

// Alım ve satım işlemlerinin gerçekleştirilmesi
if (buySignal)
    strategy.entry("Buy", strategy.long)
if (sellSignal)
    strategy.close("Buy")

if (sellSignal)
    strategy.entry("Sell", strategy.short)
if (buySignal)
    strategy.close("Sell")