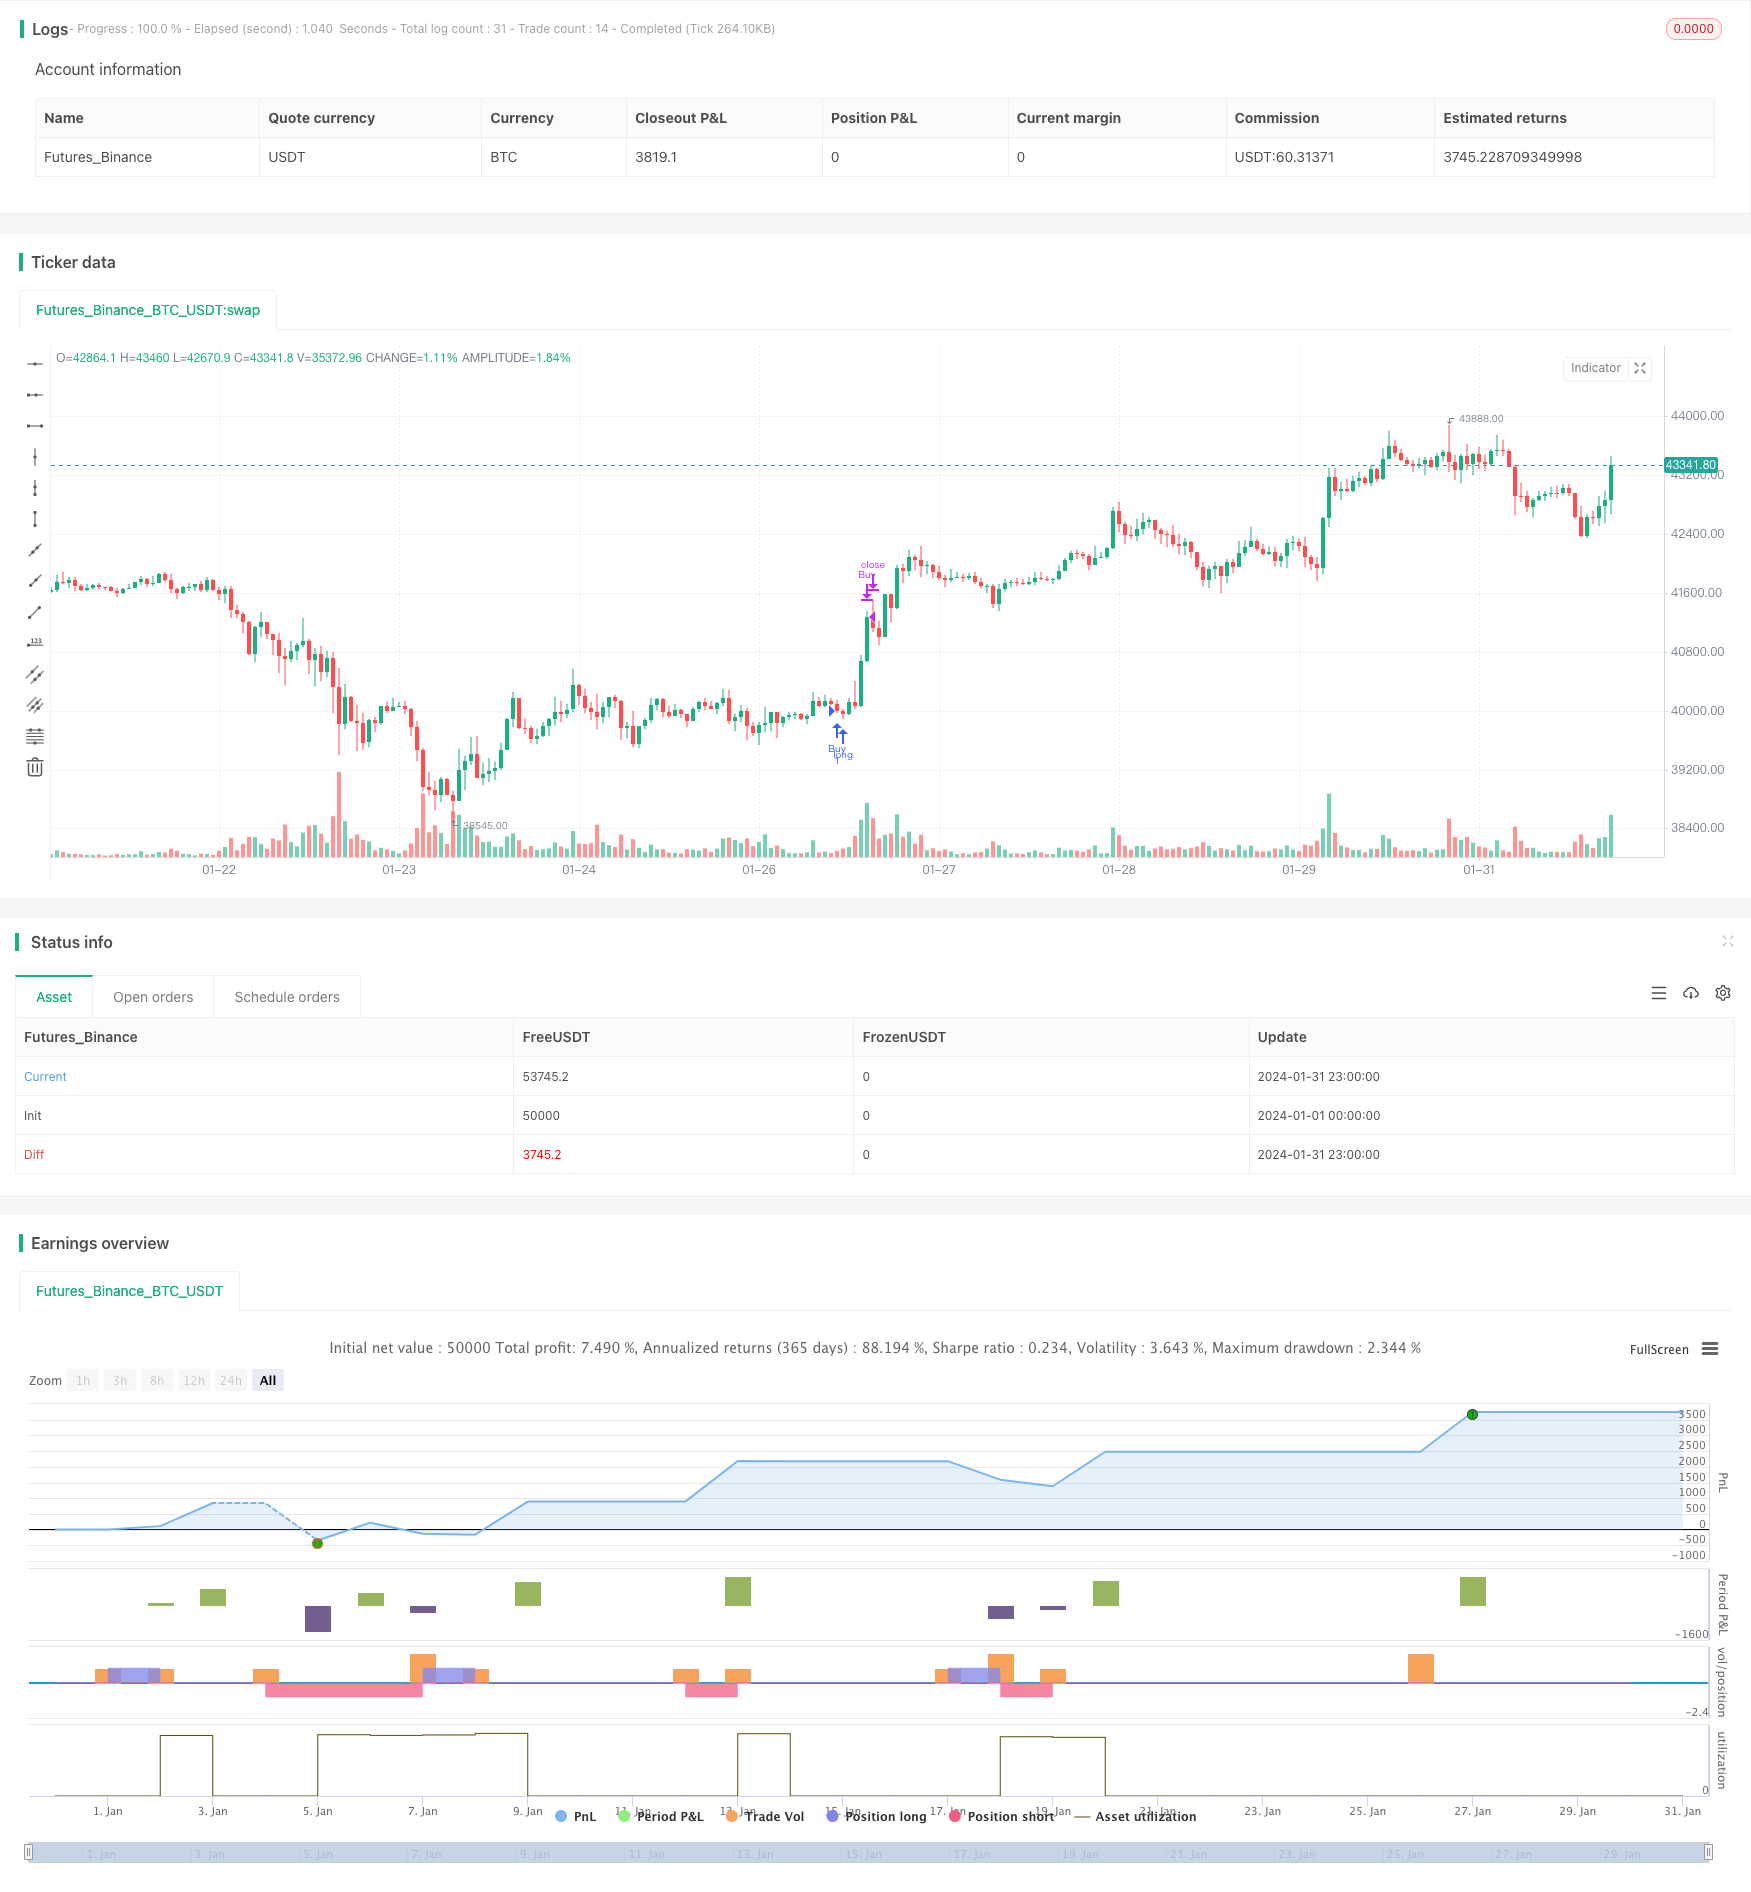
Overview
The strategy is called “Double Moving Average Bottom Pick” strategy. It uses the combination of EMA and RSI indicators to generate trading signals and sets stop loss and take profit conditions to control losses and achieve profit target. The strategy is applicable to trading BTC/USD and other cryptocurrencies.
Strategy Logic
The core technical indicators of this strategy are 50-day EMA and 100-day SMA. A buy signal is generated when the short-term EMA crosses over the long-term SMA, and a sell signal is generated when the EMA crosses below the SMA. This is a typical trend following strategy. The RSI indicator is also incorporated to gauge whether the market is overbought or oversold. The overbought level is set at 70 and oversold level at 30 to avoid unnecessary chasing high and killing lows.
The specific trading rules are as follows:
Buy Condition: 50-day EMA crosses over 100-day SMA Sell Condition: 50-day EMA crosses below 100-day SMA
Take Profit Condition: Close long position when RSI greater than 70; Close short position when RSI less than 30.
Advantages
The strategy integrates multiple technical indicators including moving averages and RSI, forming relatively stable and reliable trading signals. Compared with single indicator strategies, the integration of multiple indicators helps filter out some false signals.
EMA responds swiftly to price changes while SMA suppresses short-term noises. The combination balances the sensitivity of the indicators.
RSI judging overbought/oversold area helps traders grasp the major trend and avoid chasing highs and killing lows.
Risks
The strategy relies on fitting indicators to historical data, posing overfitting risks. Significant market regime change can undermine strategy performance. Also, high volatility and difficulty in stop loss point setting in crypto markets remain a practical challenge.
Solutions:
1. Continue parameter tuning and signal quality improvement
2. Incorporate more factors to evaluate trading opportunities
3. Dynamically adjust stop loss to optimize stop loss strategy
Optimization Directions
The strategy can be further enhanced from the following aspects:
Integrate more technical indicators like MACD and Bollinger Bands to form an indicator cluster and strengthen signal robustness.
Try machine learning models to auto tune parameters. Currently parameters depend on empirical assumptions. Algorithms like reinforcement learning and evolutionary optimization can find optimized parameters automatically.
Incorporate trading volume indicators. Volume confirmation prevents false breakout signals without substantive volume backup.
Build in automated stop loss strategies. By tracking metrics like volatility dynamics, stop loss points can be adjusted dynamically.
Conclusion
The strategy consolidates EMA, SMA and RSI to form stable trading signals. Clear take profit and stop loss rules control capital risks. But issues like overfitting, difficulty in stop loss point setting still exist. Future improvements will focus on enhancing signal quality, optimizing stop loss strategies etc.
/*backtest
start: 2024-01-01 00:00:00
end: 2024-01-31 23:59:59
period: 1h
basePeriod: 15m
exchanges: [{"eid":"Futures_Binance","currency":"BTC_USDT"}]
*/

// This Pine Script™ code is subject to the terms of the Mozilla Public License 2.0 at https://mozilla.org/MPL/2.0/
// © Wallstwizard10

//@version=4
strategy("Estrategia de Trading", overlay=true)

// Definir las EMA y SMA
ema50 = ema(close, 50)
sma100 = sma(close, 100)

// Definir el RSI
rsiLength = input(14, title="RSI Length")
overbought = input(70, title="Overbought Level")
oversold = input(30, title="Oversold Level")
rsi = rsi(close, rsiLength)

// Condiciones de Compra
buyCondition = crossover(ema50, sma100) // EMA de 50 cruza SMA de 100 hacia arriba

// Condiciones de Venta
sellCondition = crossunder(ema50, sma100) // EMA de 50 cruza SMA de 100 hacia abajo

// Salida de Operaciones
exitBuyCondition = rsi >= overbought // RSI en niveles de sobrecompra
exitSellCondition = rsi <= oversold // RSI en niveles de sobreventa

// Lógica de Trading
if (buyCondition)
    strategy.entry("Buy", strategy.long)

if (sellCondition)
    strategy.entry("Sell", strategy.short)

if (exitBuyCondition)
    strategy.close("Buy")

if (exitSellCondition)
    strategy.close("Sell")