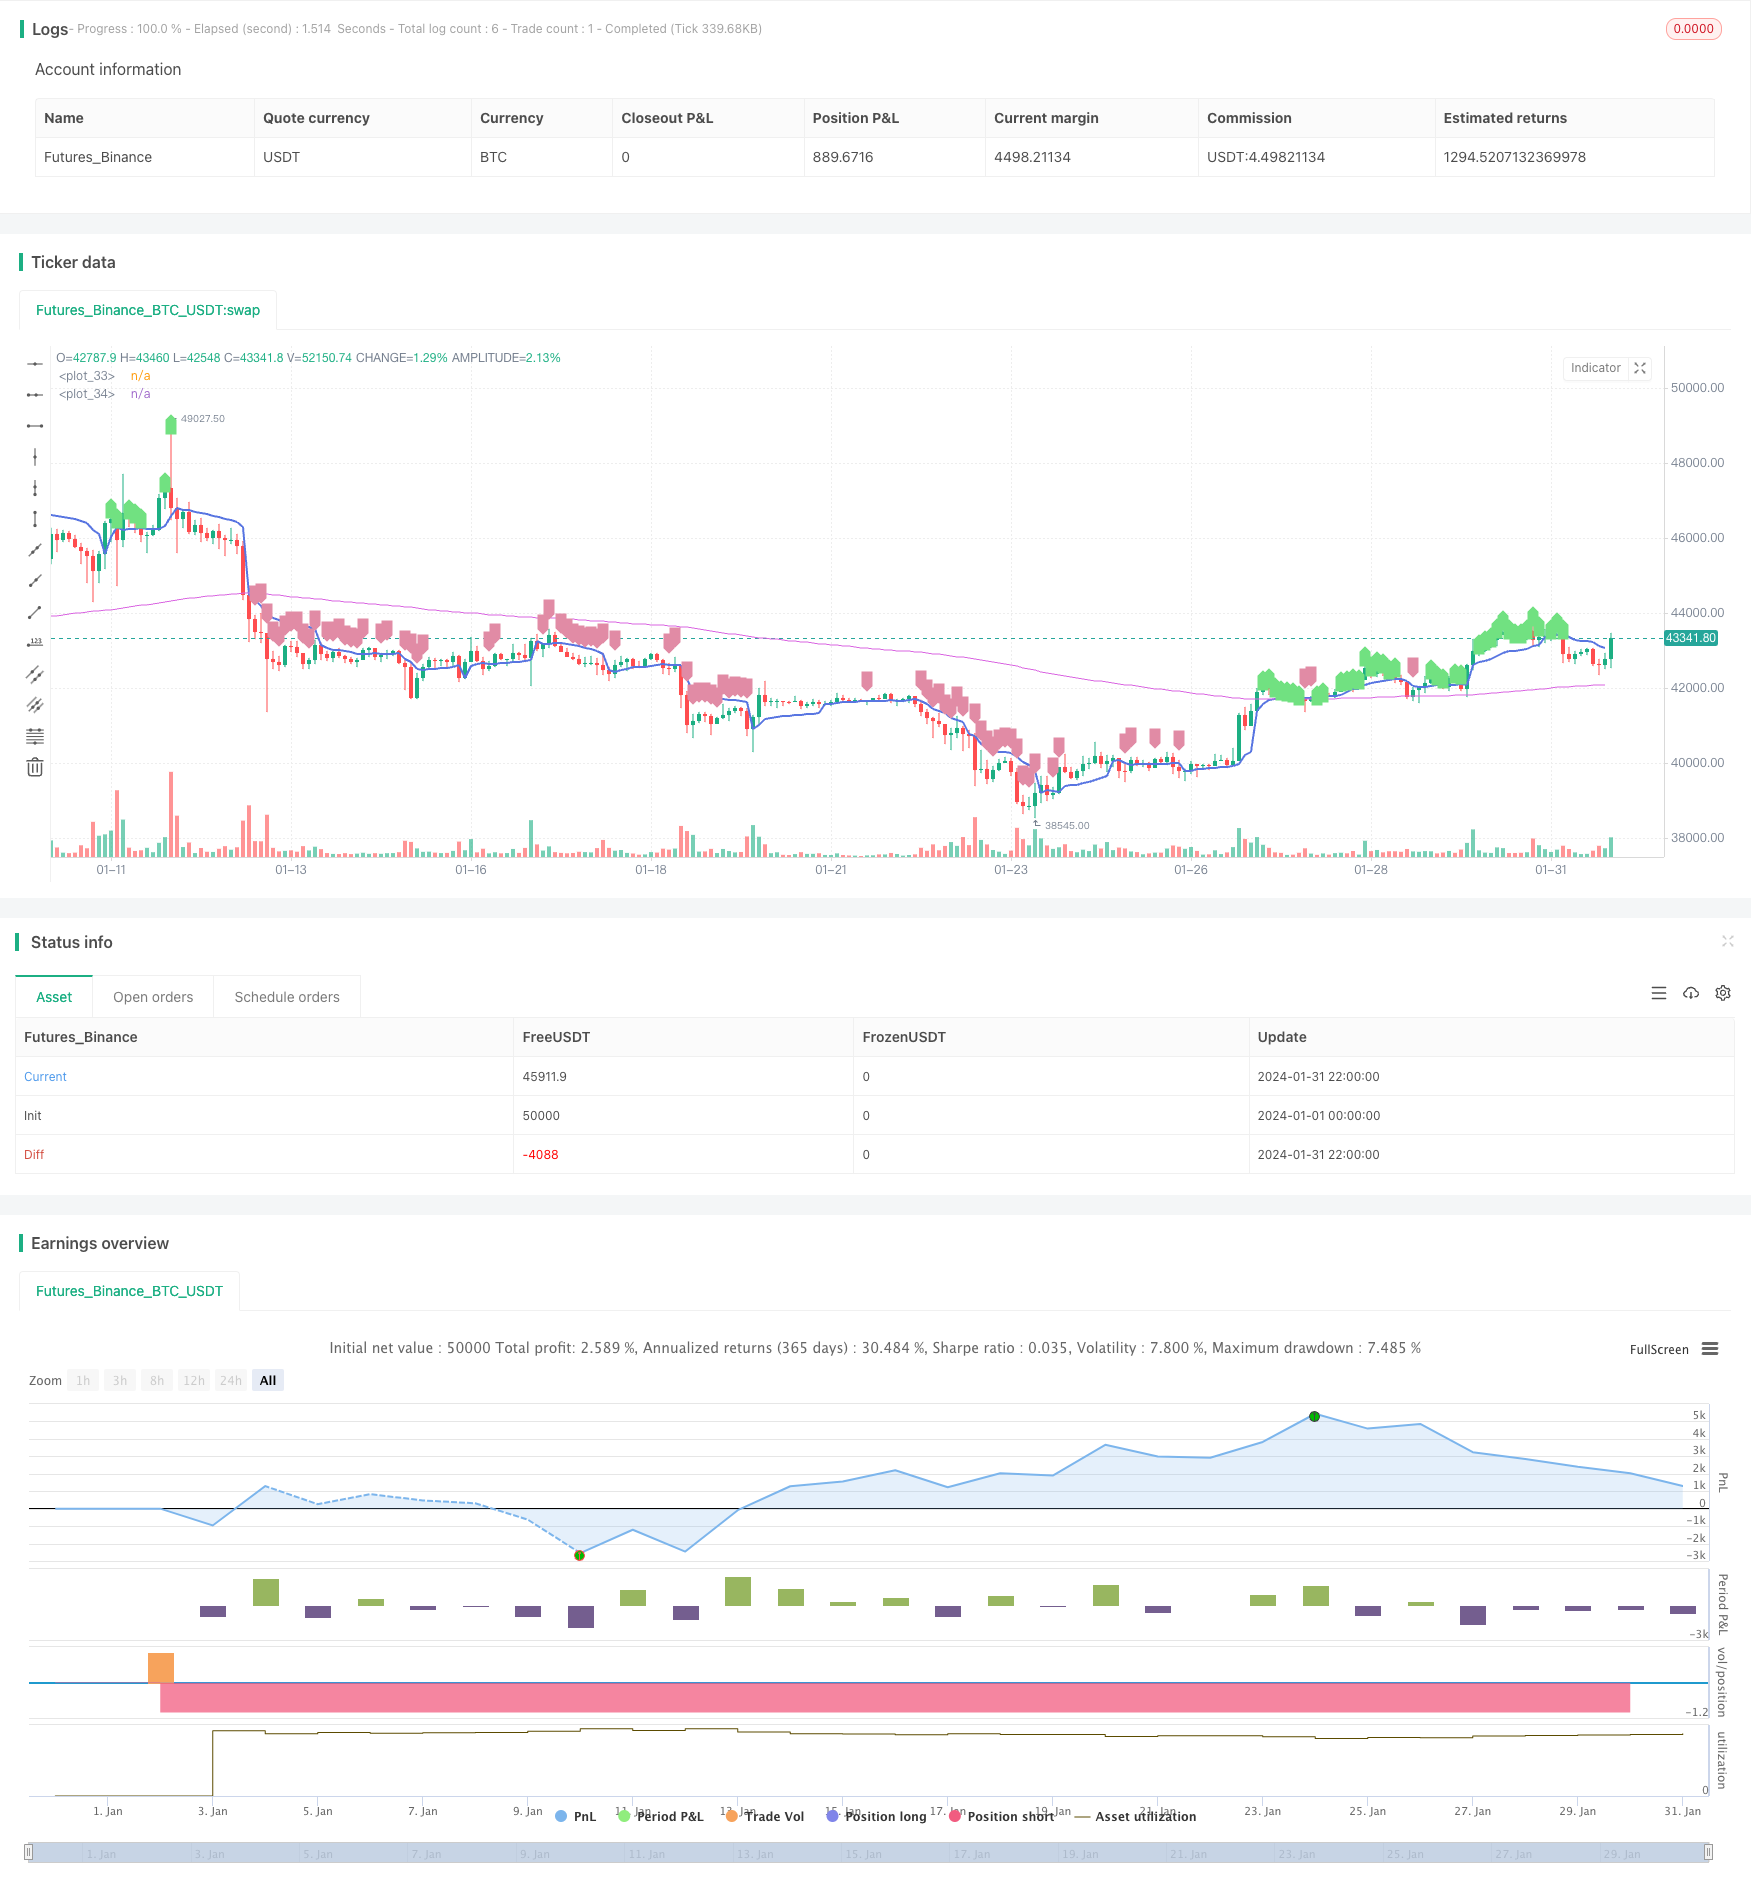
Overview
This strategy uses VWAP and EMA as indicators to determine the trend direction. It goes long when the price is above both VWAP and EMA200, and goes short when the price is below both VWAP and EMA200. It’s a typical trend following strategy.
Strategy Logic
The core logic of the strategy lies in using VWAP and EMA to judge the price trend.
VWAP represents the typical price and reflects the average cost of market participants. When price is above VWAP, it means the buying power increases and should go long. When price is below VWAP, it means the selling power strengthens and should go short.
EMA200 represents the mid-long term trend of the price. When price is above EMA200, it means mid-long term outlook is bullish and should go long. When price is below EMA200, it means mid-long term outlook is bearish and should go short.
Therefore, this strategy first judges if the price is above both VWAP and EMA200, if yes then go long; if the price is below both VWAP and EMA200, then go short. We can see that this strategy mainly relies on VWAP and EMA to make trading decisions.
In addition, the strategy also sets take profit and stop loss points. After going long, TP is set to 3.5% of the entry price and SL is set to 1.4% of entry price. After going short, TP is 2.5% of entry price and SL is 0.9% of entry price. This avoids huge losses.
Advantages
The biggest advantage of this strategy is that using VWAP and EMA to determine trends is very reliable.
- VWAP can accurately reflect the average cost of market participants, it’s a very good indicator to judge trends.
- EMA200 can clearly reflect the mid-long term trend and determine the direction of major trends very accurately.
Therefore, combining VWAP and EMA to judge trends is highly reliable. When both indicators give consistent signals, the success rate of trading is very high.
In addition, setting TP/SL avoids excessive losses per trade.
Risks
The main risk of this strategy is that VWAP and EMA may give wrong signals.
- When there is violent market fluctuation, the price may deviate from VWAP in short term and give wrong signals.
- When a new trend just begins, EMA may lag the price change and cause missing the best entry timing.
Also, improper TP/SL settings still poses the risk of excessive losses per trade.
To solve the above issues, we can optimize the parameters of VWAP and EMA to make them better in detecting the beginning of new trends. Also we can set adaptive TP/SL to adjust them according to price fluctuation.
Enhancement
The main aspects to enhance this strategy:
- Optimize VWAP parameters to find more stable settings in determining trends.
- Optimize EMA periods to find more accurate settings in judging trends.
- Add other trend indicators like Bollinger Bands, KDJ etc. to combine with VWAP and EMA, to improve accuracy.
- Set adaptive take profit and stop loss based on certain rules to adjust them dynamically according to price fluctuation.
- Incorporate position sizing based on drawdown, consecutive losses etc. to control overall risk.
Conclusion
In conclusion, this is a very reliable trend following strategy. It uses simple logic of VWAP and EMA to determine trend directions. When both indicators give consistent signals, the success rate is very high. By setting proper TP/SL, the risk can be controlled. There are still many ways (parameter optimization, adding indicators, adaptive TP/SL, position sizing etc.) to further improve this strategy and make its performance even better.
/*backtest
start: 2024-01-01 00:00:00
end: 2024-01-31 23:59:59
period: 2h
basePeriod: 15m
exchanges: [{"eid":"Futures_Binance","currency":"BTC_USDT"}]
*/

//26m Binance BTCUSDTPERP
//@version=4
strategy("VWAP Trend Follower", initial_capital=100, overlay=true, commission_type=strategy.commission.percent, commission_value=0.04, default_qty_type = strategy.percent_of_equity, default_qty_value = 90, currency = currency.USD )

/// INITIALISE STRATEGY ///
price=close[1]
vprice=vwap(price)
trend=ema(price, 200)

/// RISK MANAGEMENT ///
long_tp_inp = input(3.5, title='Long Take Profit %',step=0.1)/100
long_sl_inp = input(1.4, title='Long Stop Loss %',step=0.1)/100
short_tp_inp = input(2.5, title='Short Take Profit %',step=0.1)/100
short_sl_inp = input(0.9, title='Short Stop Loss %',step=0.1)/100
long_take_level = strategy.position_avg_price * (1 + long_tp_inp)
long_stop_level = strategy.position_avg_price * (1 - long_sl_inp)
short_take_level = strategy.position_avg_price * (1 - short_tp_inp)
short_stop_level = strategy.position_avg_price * (1 + short_sl_inp)
//long_trailing = input(5, title='Trailing Stop Long',step=0.1) / 100
//short_trailing = input(5, title='Trailing Stop short',step=0.1) / 100

/// STRATEGY CONDITIONS ///
aLong= price > trend and price > vprice
entry_long = aLong and aLong[2] and aLong[1]
aShort= price < trend and price < vprice
entry_short = aShort and aShort[2] and aShort[1]
//exit_long =
//exit_short =
//entry_price_long=valuewhen(entry_long,close,0)
//entry_price_short=valuewhen(entry_short,close,0)

/// PLOTTING ///
plot(vprice,                color=#5875E1, linewidth=2)
plot(trend,                 color=#D965E1, linewidth=1)
plotshape(series=aLong,     color=#71E181,style=shape.labelup)
plotshape(series=aShort,    color=#E18BA5,style=shape.labeldown)
//plot(long_take_level,     color=#00E676, linewidth=2)
//plot(long_stop_level,     color=#FF5252, linewidth=1)
//plot(short_take_level,    color=#4CAF50, linewidth=2)
//plot(short_stop_level,    color=#FF5252, linewidth=1)

/// PERIOD ///
testStartYear   = input(2019, "Backtest Start Year")
testStartMonth  = input(1, "Backtest Start Month")
testStartDay    = input(1, "Backtest Start Day")
testPeriodStart = timestamp(testStartYear,testStartMonth,testStartDay,0,0)
testStopYear    = input(2020, "Backtest Stop Year")
testStopMonth   = input(12, "Backtest Stop Month")
testStopDay     = input(31, "Backtest Stop Day")
testPeriodStop  = timestamp(testStopYear,testStopMonth,testStopDay,0,0)
testPeriod() => true

//// STRATEGY EXECUTION ////

if testPeriod()
    if strategy.position_size == 0 or strategy.position_size > 0
        strategy.entry(id="Long", long=true, when=entry_long, comment="Long")
        strategy.exit("Take Profit/ Stop Loss","Long", limit=long_take_level, stop=long_stop_level,comment="Exit Long")//,trail_points=entry_price_long * long_trailing / syminfo.mintick, trail_offset=entry_price_long * long_trailing / syminfo.mintick)
//        strategy.close(id="Long", when=exit_long, comment = "Exit Long")

    if strategy.position_size == 0 or strategy.position_size < 0
        strategy.entry(id="Short", long=false, when=entry_short, comment = "Short")
        strategy.exit("Take Profit/ Stop Loss","Short", limit=short_take_level , stop=short_stop_level,comment = "Exit Short")//, trail_points=entry_price_short * short_trailing / syminfo.mintick, trail_offset=entry_price_short * short_trailing / syminfo.mintick)
//        strategy.close(id="Short", when=exit_short, comment = "Exit Short")