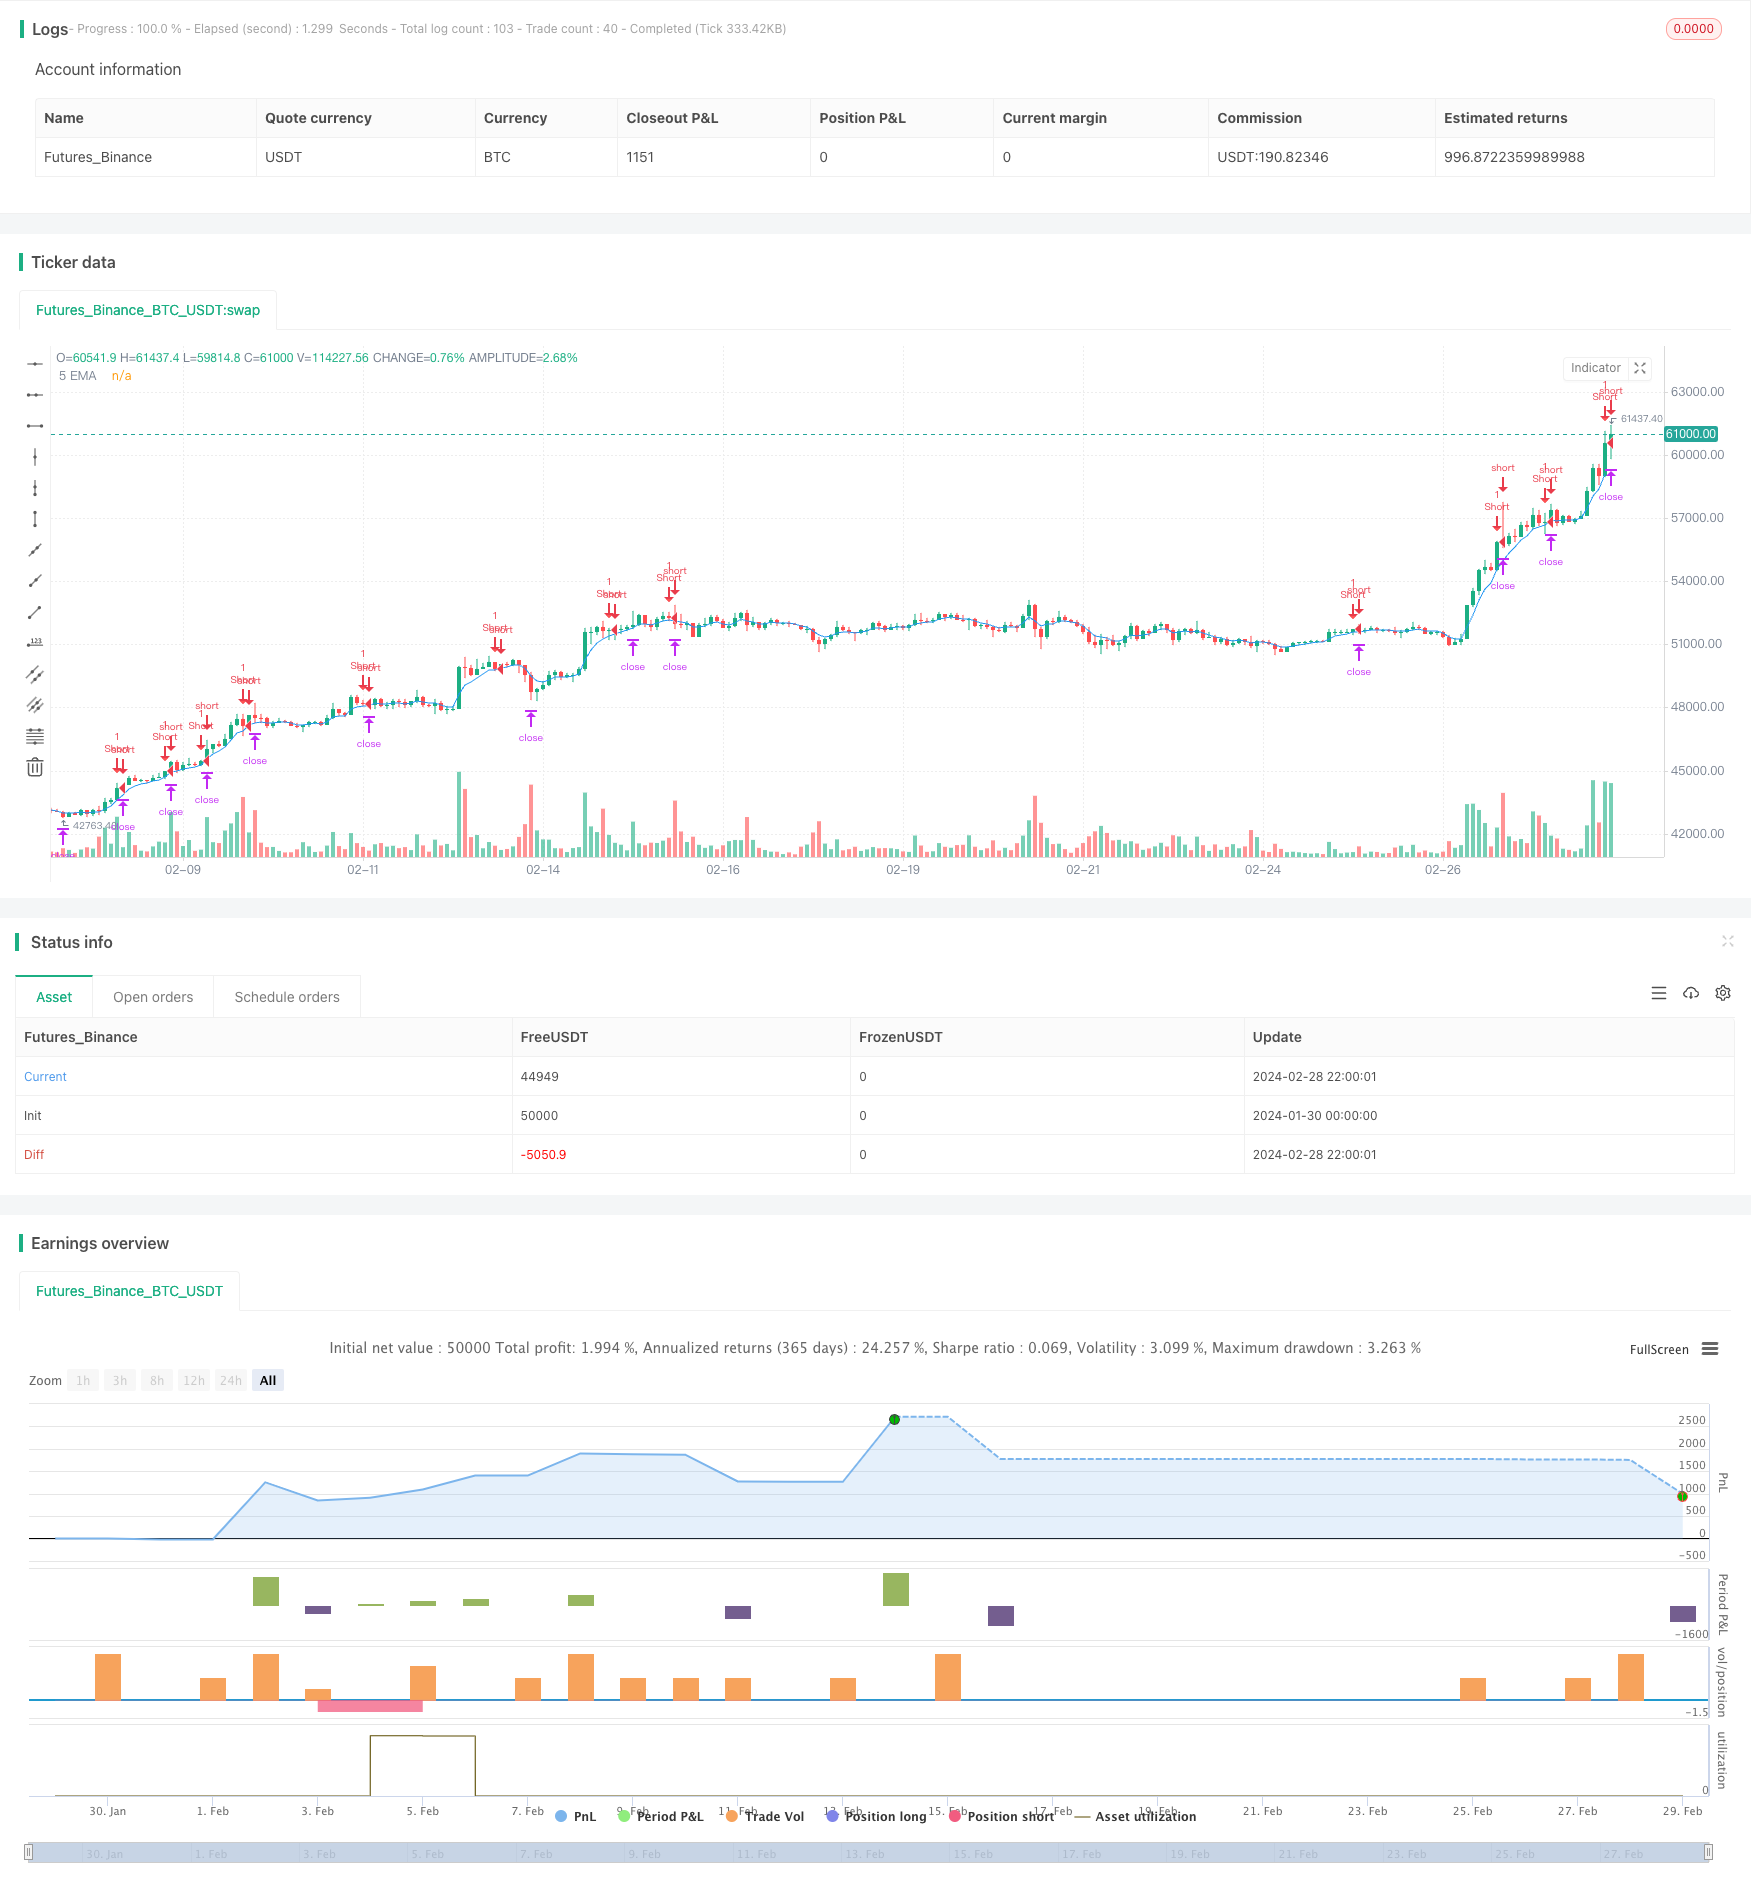
Overview
This is a breakout trading strategy based on the EMA indicator. When the price breaks through the EMA, it is considered as an entry signal. It adopts triangle stop loss to set the stop loss and take profit, with high profit potential.
Principles
The strategy calculates the 5-day EMA as an indicator. When the close price touches the 5-day EMA from above, it is a signal for going short. Then the entry price is set to the high of the signal bar, the stop loss is set to the highest point of the previous bar, and the take profit is set to the entry price minus 3 times the risk value (assuming a 2:1 risk-reward ratio for TP calculation). So when the price breaks through the EMA downward, we go short; if the price rebounds again, the stop loss point can keep the loss within a certain range; and the triangle take profit can achieve a good risk-reward ratio.
Advantages
This is a relatively simple breakout EMA strategy with the following strengths:
1. Simple and clear rules, easy to implement;
2. EMA depicts price trends well, easy to profit from breakout signals;
3. Triangle stop loss for better risk-reward ratio;
4. Visual SL and TP for better risk control.
Risks
The strategy also has some risks: 1. Sudden huge market change may make SL invalid; 2. EMA lag may miss best entry point; 3. Triangle trap.
To control risks, we can combine other indicators to determine the major trend, avoid trading against trends; we can also adjust the stop loss range based on market volatility.
Improvements
This is a simple strategy, and can be improved in the following aspects:
1. Optimize EMA parameters for different cycles;
2. Add other indicators to improve stability;
3. Adopt dynamic SL based on market volatility;
4. Combine trading volumes to avoid false breakout.
Conclusion
In summary, this is a simple and practical short-term EMA breakout strategy. It has advantages like clear rules, easy to implement, complete SL and TP. But it also has risks like being trapped. Going forward it can be improved by adjusting parameters, adding indicators, dynamic stops etc., to make the strategy more stable and reliable.
/*backtest
start: 2024-01-30 00:00:00
end: 2024-02-29 00:00:00
period: 2h
basePeriod: 15m
exchanges: [{"eid":"Futures_Binance","currency":"BTC_USDT"}]
*/

//@version=5
strategy("Short Entry EMA Strategy with Visual SL and TP", shorttitle="SE-EMA-SL-TP-Viz", overlay=true)

// Customization Inputs
emaPeriod = input.int(5, title="EMA Period", minval=1)

// EMA Calculation
emaValue = ta.ema(close, emaPeriod)
plot(emaValue, title="5 EMA", color=color.blue)

// Detecting Short Entry Conditions
shortEntryCondition = close > emaValue and low <= emaValue and low[1] > emaValue[1] and close[1] > emaValue[1]

// Entry, SL, and TP Logic
if (shortEntryCondition)
    entryPrice = open[1]
    slLevel = high[1]
    risk = slLevel - entryPrice
    tpLevel = entryPrice - risk * 3  // Assuming a 2:1 risk-reward ratio for TP calculation

    // Execute short trade
    strategy.entry("Short", strategy.short)
    strategy.exit("Exit", "Short", stop=slLevel, limit=tpLevel)

    // Visualizing SL and TP levels
    // line.new(bar_index, slLevel, bar_index + 20, slLevel, color=color.red, width=2)
    // line.new(bar_index, tpLevel, bar_index + 20, tpLevel, color=color.green, width=2)

// Plotting Short Entry Signal
plotshape(series=shortEntryCondition, style=shape.triangledown, location=location.abovebar, color=color.red, title="Short Signal")