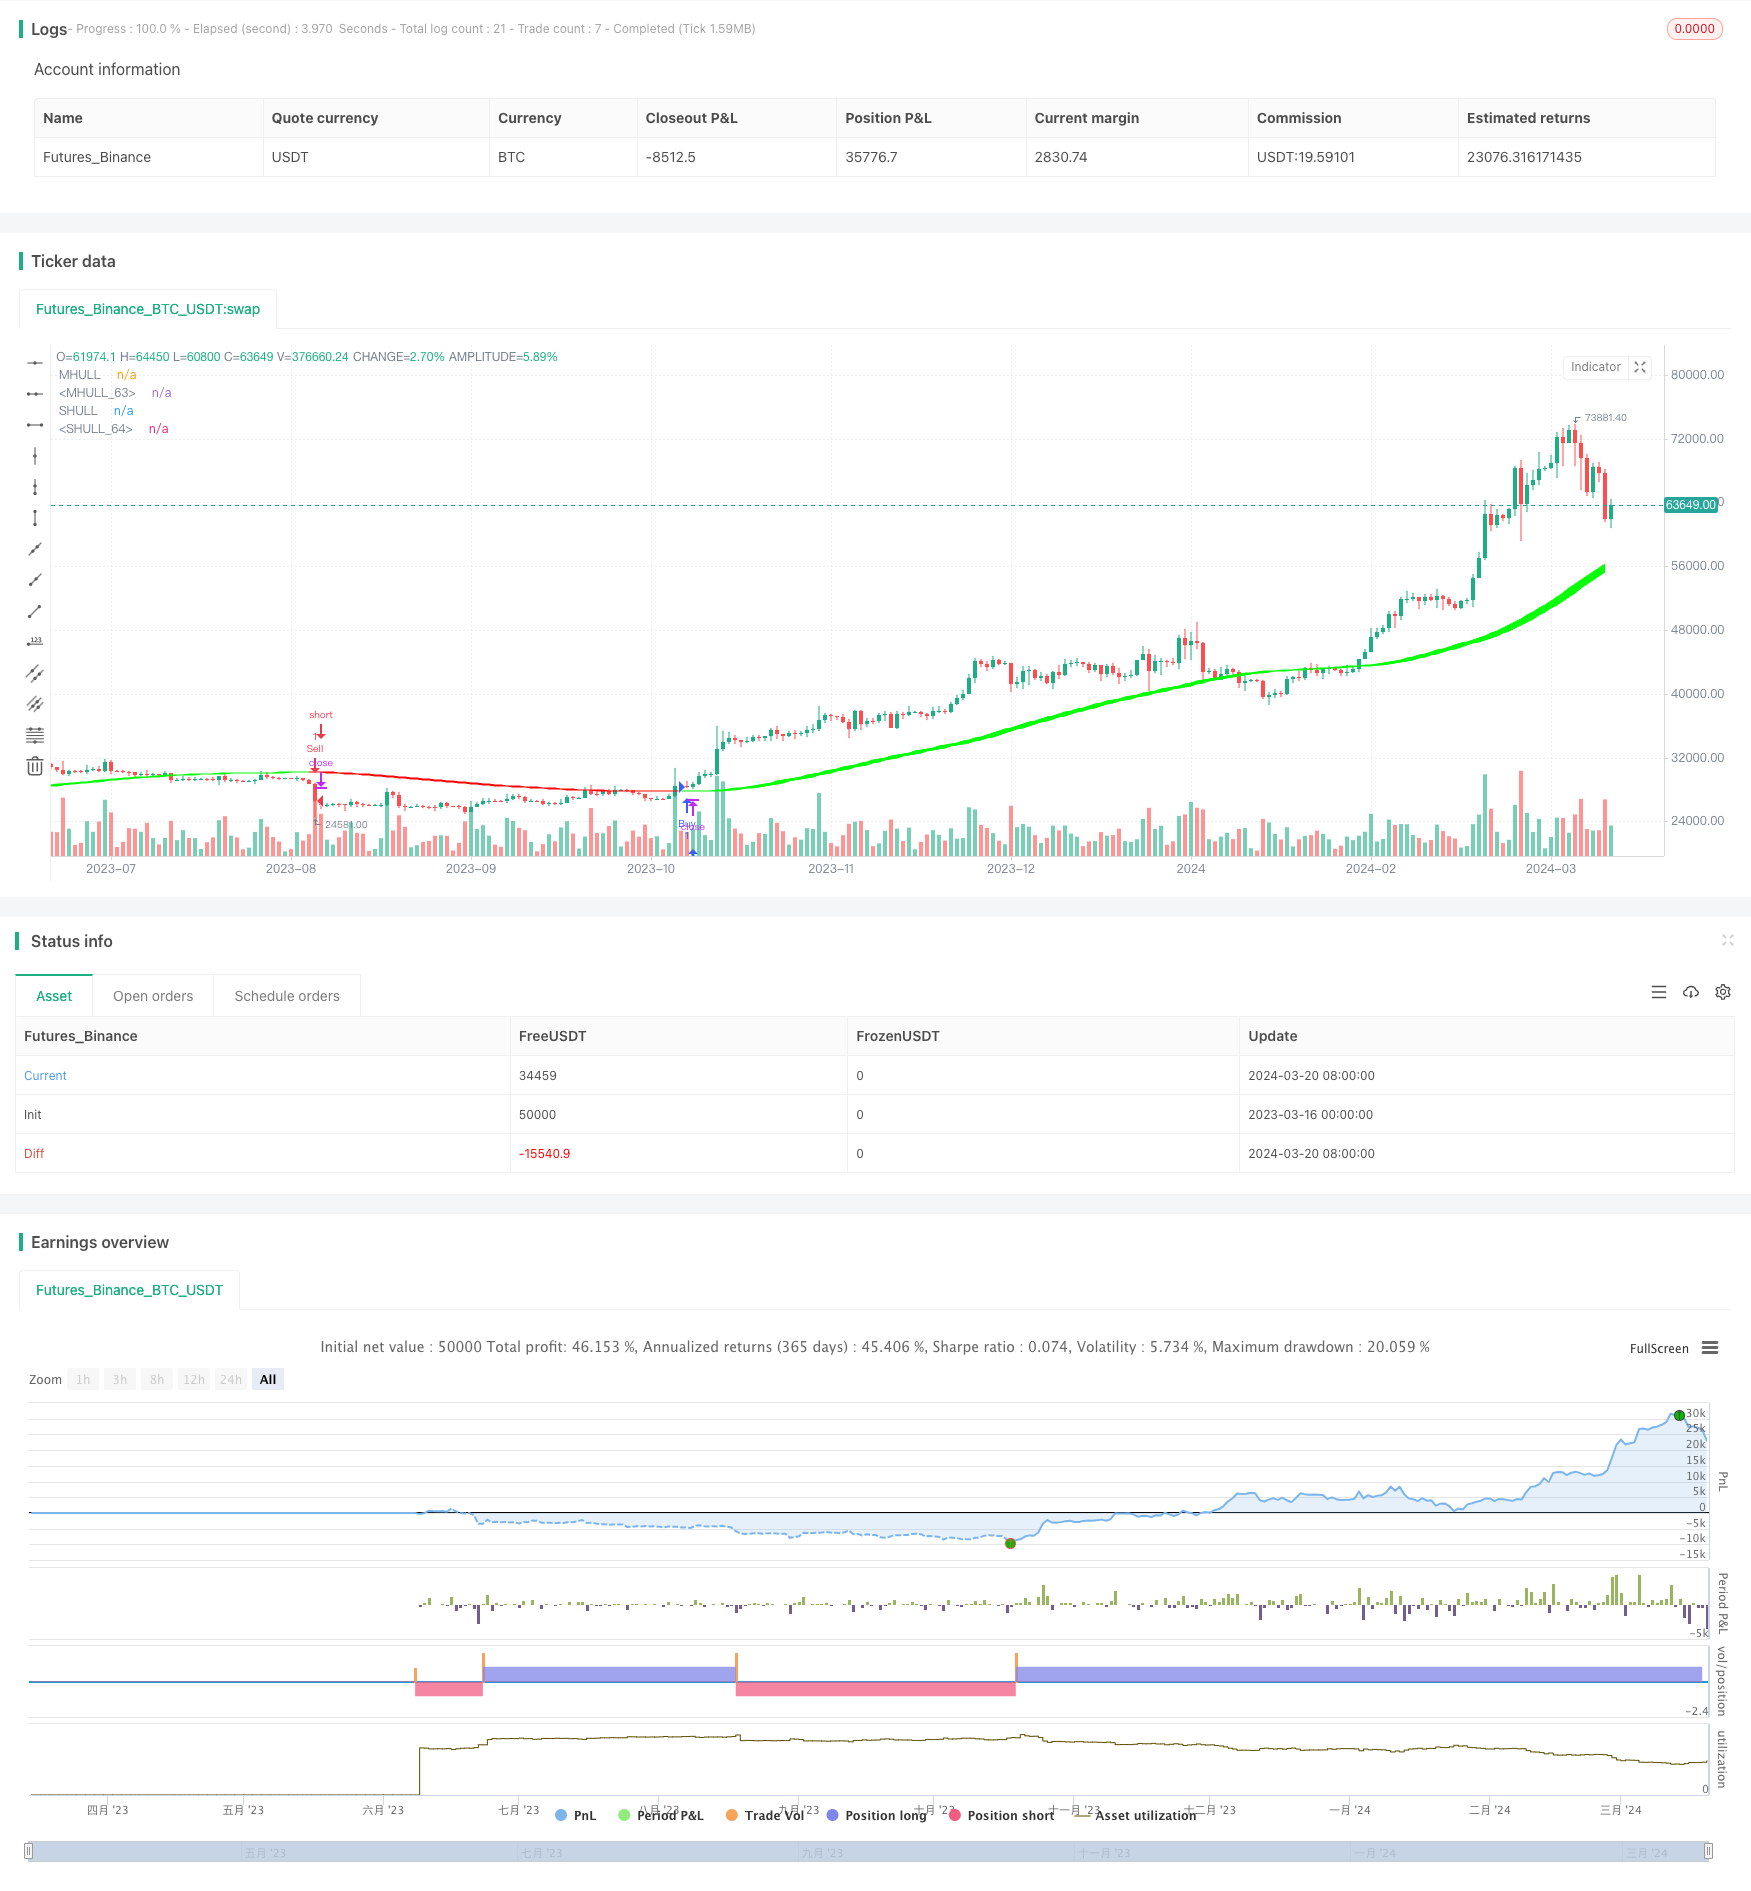
Overview
This strategy is based on the crossover signals of the Hull Moving Average (HMA). The Hull Moving Average is a technical indicator developed by Alan Hull, which aims to reduce the lag of traditional moving averages. The strategy uses two HMAs with different periods. A buy signal is generated when the shorter-period HMA crosses above the longer-period HMA, and a sell signal is generated when the opposite occurs.
Principle
- Calculating the Hull Moving Average (HMA)
The HMA is calculated as follows: - First, calculate the Weighted Moving Average (WMA) of the price with a period of half the input parameter ‘length’ - Then, calculate the WMA of the previous WMA with a period of ‘length’ - Use the formula: HMA = 2 * WMA(length/2) - WMA(length) - Calculate the WMA of the above result again with a period of the square root of ‘length’ to get the final HMA
- Generating Trading Signals
- When the closing price crosses above the HMA, a buy signal is generated
- When the closing price crosses below the HMA, a sell signal is generated
- Executing Trades Based on Signals
- Buy signal: Open a long position
- Sell signal: Open a short position
Advantages
Compared to Simple Moving Average and Weighted Moving Average, the Hull Moving Average has less lag, thus it can react faster to price changes, improving the strategy’s responsiveness.
By using the crossover of two HMAs with different periods to generate signals, a lot of noise and false signals can be effectively filtered out, enhancing the reliability of the signals.
The parameters are adjustable. By tuning the period parameters of the HMAs, the strategy can be adapted to different markets and trading instruments.
Risks
The Hull Moving Average is a lagging indicator, which may generate false signals in the early stages of a trend reversal.
Inappropriate parameter selection may lead to poor strategy performance. If the period is too long, the strategy will be sluggish in response; if the period is too short, it may lead to excessive false signals.
Like all strategies based on a single indicator, this strategy may not perform well in sideways markets, generating more false signals and losing trades.
Optimization Directions
Consider introducing other technical indicators or fundamental factors as filters, such as trading volume, trend indicators, etc., to further confirm the validity of the HMA crossover signals.
For parameter optimization, methods such as genetic algorithms and grid search can be used to find the optimal parameter combination on historical data that best suits the current market.
Incorporate stop-loss and take-profit mechanisms into the strategy to control the risk and return of each trade.
Consider the trendiness of the market. By introducing indicators for judging market trends, one can trade in trending markets and avoid sideways markets.
Summary
The Hull Moving Average Crossover strategy is a simple and easy-to-use trading strategy. With the fast-response characteristic of HMA, it can capture price changes in a timely manner. However, like all strategies, it also has its limitations and its performance will be affected by market types and parameter selection. In practical application, it can be combined with other analysis methods to further confirm the signals. At the same time, reasonable risk control measures, such as stop-loss and take-profit, position management, etc., are also indispensable parts for the stable operation of the strategy.
/*backtest
start: 2023-03-16 00:00:00
end: 2024-03-21 00:00:00
period: 1d
basePeriod: 1h
exchanges: [{"eid":"Futures_Binance","currency":"BTC_USDT"}]
*/

//@version=4
//Basic Hull Ma Pack tinkered by InSilico
strategy("RKTD BETA - Hull Suite by InSilico", overlay=true)

//INPUT
src = input(close, title="Source")
modeSwitch = input("Ehma", title="Hull Variation", options=["Hma", "Thma", "Ehma"])
length = input(200, title="Length(180-200 for floating S/R , 55 for swing entry)")
lengthMult = input(1.0, title="Length multiplier (Used to view higher timeframes with straight band)")

useHtf = input(false, title="Show Hull MA from X timeframe? (good for scalping)")
htf = input("240", title="Higher timeframe", type=input.resolution)

switchColor = input(true, "Color Hull according to trend?")
candleCol = input(false,title="Color candles based on Hull's Trend?")
visualSwitch  = input(true, title="Show as a Band?")
thicknesSwitch = input(1, title="Line Thickness")
transpSwitch = input(40, title="Band Transparency",step=5)

// Alert Messages
longAlertMessage = '{"base": "BTC", "quote": "USDT", "price": ' + tostring(close) + ', "action": "long", "orderType": "market", "close":true}'
shortAlertMessage = '{"base": "BTC", "quote": "USDT", "price": ' + tostring(close) + ', "action": "short", "orderType": "market", "close":true}'

//FUNCTIONS
//HMA
HMA(_src, _length) =>  wma(2 * wma(_src, _length / 2) - wma(_src, _length), round(sqrt(_length)))
//EHMA
EHMA(_src, _length) =>  ema(2 * ema(_src, _length / 2) - ema(_src, _length), round(sqrt(_length)))
//THMA
THMA(_src, _length) =>  wma(wma(_src,_length / 3) * 3 - wma(_src, _length / 2) - wma(_src, _length), _length)

//SWITCH
Mode(modeSwitch, src, len) =>
      modeSwitch == "Hma"  ? HMA(src, len) :
      modeSwitch == "Ehma" ? EHMA(src, len) :
      modeSwitch == "Thma" ? THMA(src, len/2) : na

//OUT
_hull = Mode(modeSwitch, src, int(length * lengthMult))
HULL = useHtf ? security(syminfo.ticker, htf, _hull) : _hull
MHULL = HULL[0]
SHULL = HULL[2]

//COLOR
hullColor = switchColor ? (HULL > HULL[2] ? #00ff00 : #ff0000) : #ff9800

//PLOT
///< Frame
Fi1 = plot(MHULL, title="MHULL", color=hullColor, linewidth=thicknesSwitch, transp=50)
Fi2 = plot(visualSwitch ? SHULL : na, title="SHULL", color=hullColor, linewidth=thicknesSwitch, transp=50)
alertcondition(crossover(MHULL, SHULL), title="Hull trending up.", message="Hull trending up.")
alertcondition(crossover(SHULL, MHULL), title="Hull trending down.", message="Hull trending down.")
///< Ending Filler
fill(Fi1, Fi2, title="Band Filler", color=hullColor, transp=transpSwitch)
///BARCOLOR
barcolor(color = candleCol ? (switchColor ? hullColor : na) : na)

// Define Buy and Sell Conditions based on crossovers
buyCondition = crossover(MHULL, SHULL)
sellCondition = crossunder(MHULL, SHULL)

// Plotting the Hull Moving Average (HMA)
plot(MHULL, title="MHULL", color=hullColor, linewidth=thicknesSwitch)
plot(SHULL, title="SHULL", color=hullColor, linewidth=thicknesSwitch, transp=transpSwitch)
fill(Fi1, Fi2, title="Band Filler", color=hullColor, transp=transpSwitch)

// Execute Strategy based on Buy and Sell Conditions
strategy.entry("Buy", strategy.long, when=buyCondition, alert_message=longAlertMessage)
strategy.entry("Sell", strategy.short, when=sellCondition, alert_message=shortAlertMessage)

// Additional elements like bar coloring remain unchanged
barcolor(color = candleCol ? (switchColor ? hullColor : na) : na)