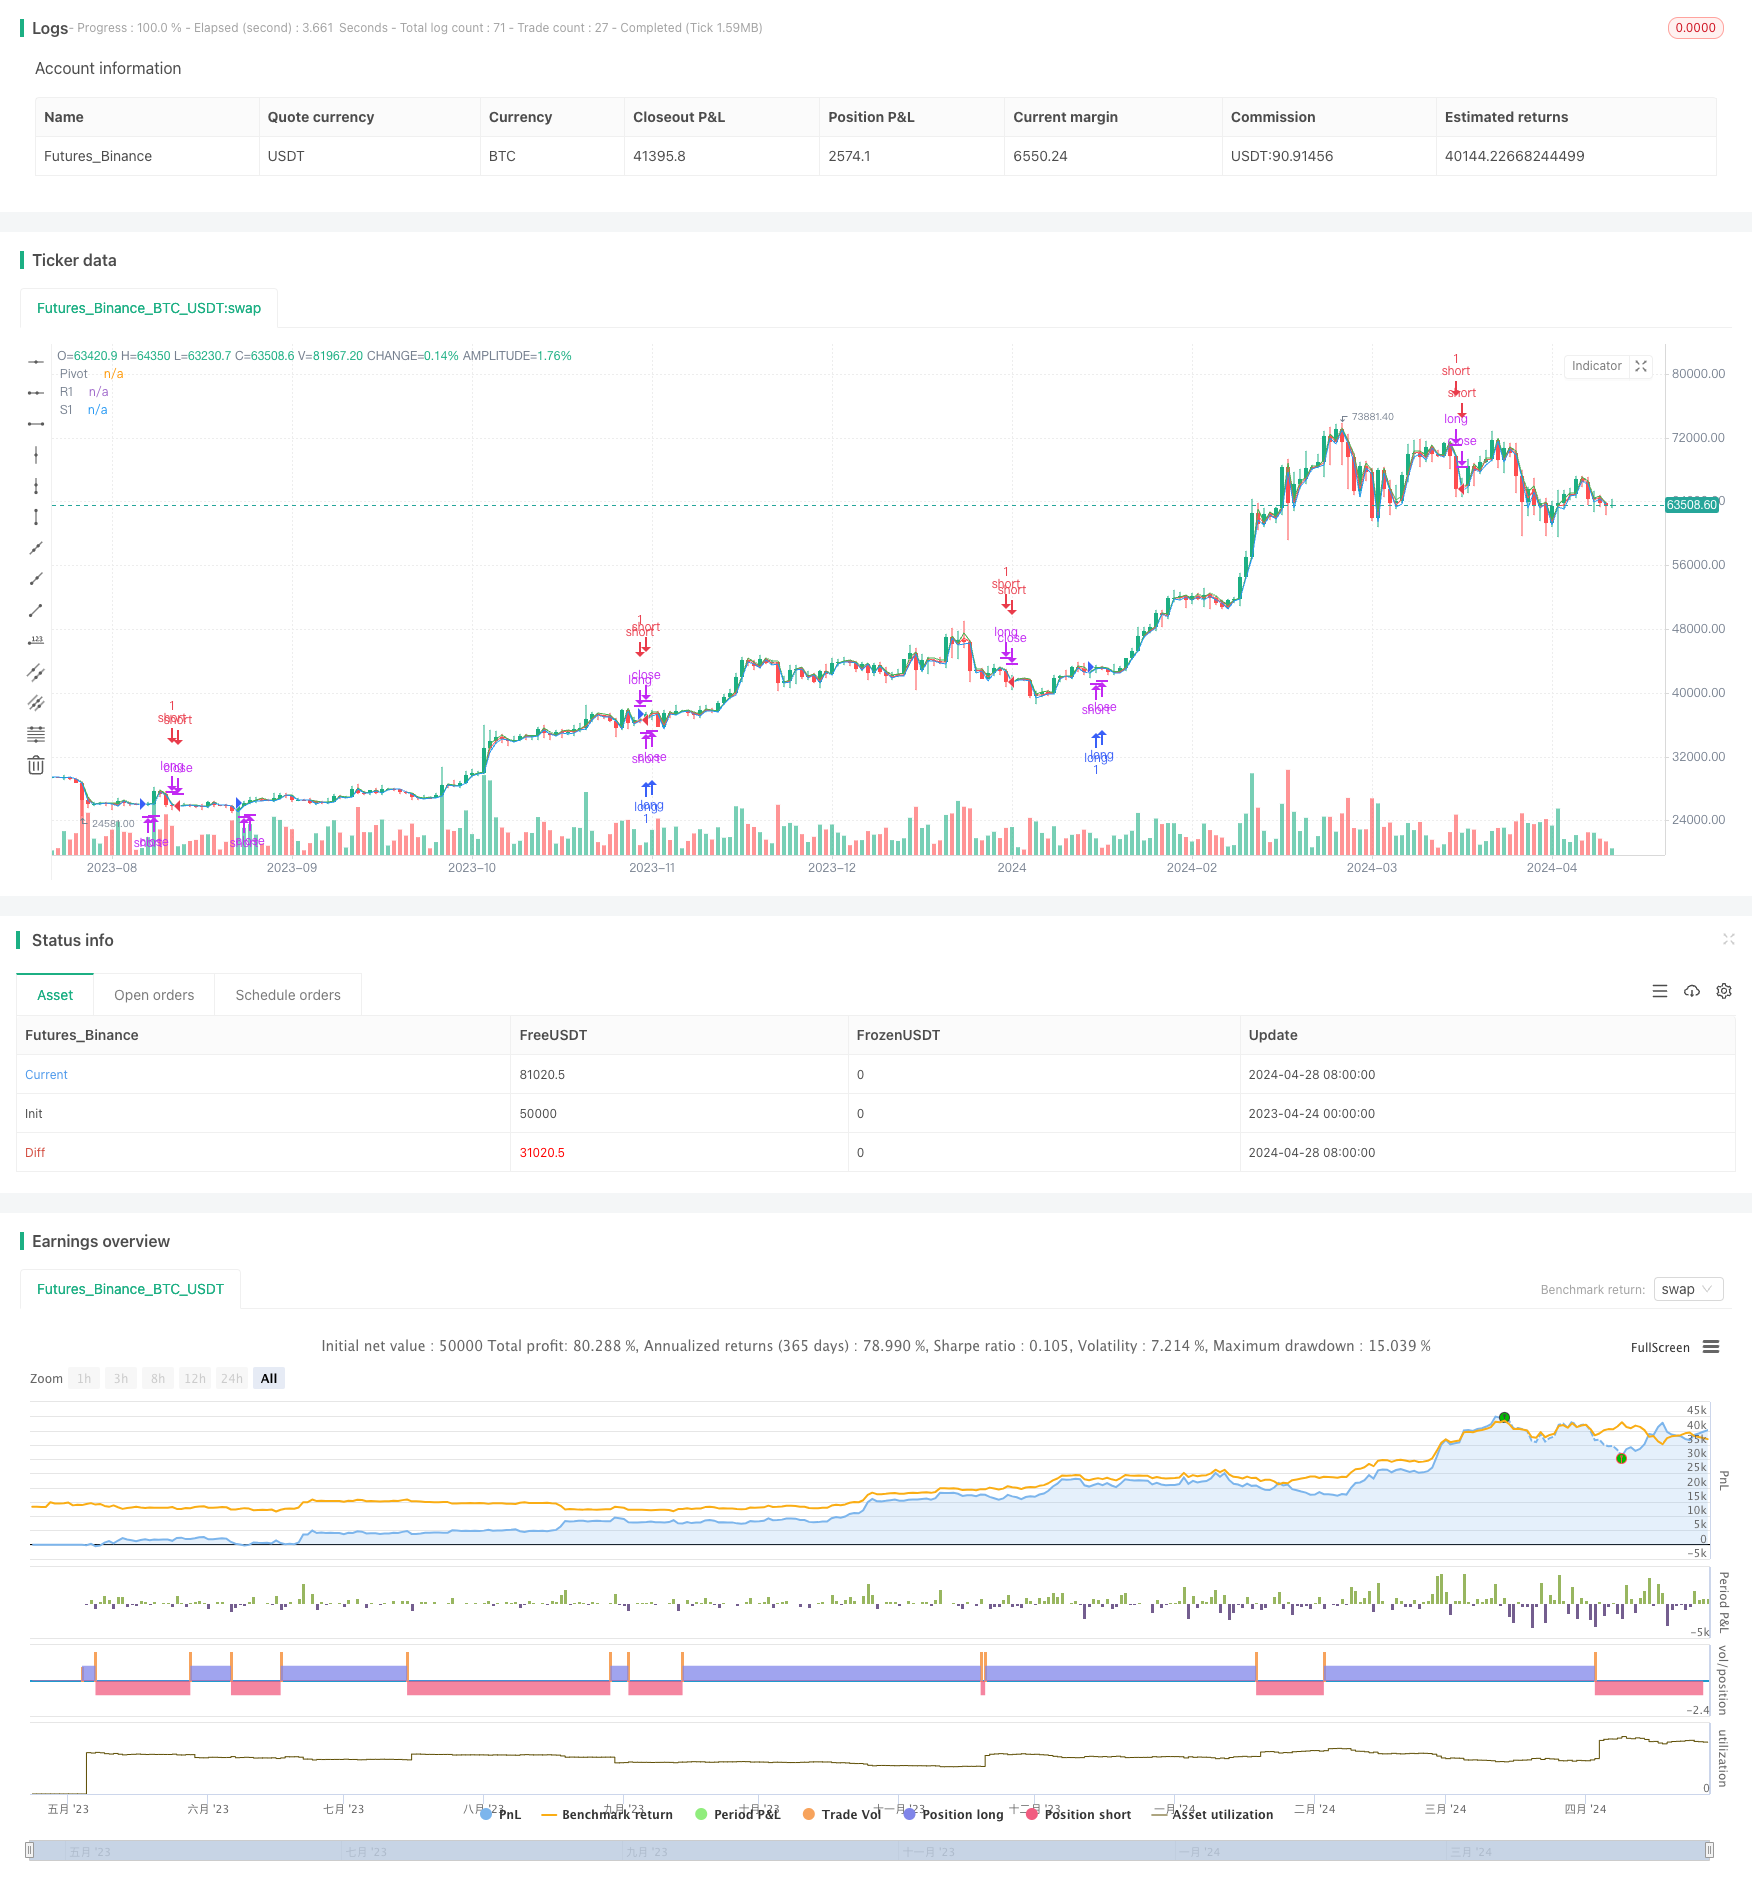
Overview
The Pivot and Momentum Strategy is a trading approach that combines pivot points and momentum indicators. The strategy utilizes the previous trading period’s high, low, and close prices to calculate pivot points and employs momentum indicators such as ROC (Rate of Change) and Stochastic RSI to determine market trends. When the price breaks above the pivot point and momentum indicators confirm, the strategy will open a position; conversely, when the price breaks below the pivot point and momentum indicators confirm, the strategy will close the position. The strategy aims to capture market trends while controlling risk.
Strategy Principle
The core of this strategy is the combination of pivot points and momentum indicators. Pivot points are calculated using the previous trading period’s high, low, and close prices, representing important support and resistance levels in the market. When the price breaks through the pivot point, it indicates that the market trend may be changing.
At the same time, the strategy employs two momentum indicators, ROC and Stochastic RSI, to confirm trends. ROC measures the speed of price change; when ROC is greater than 0, it indicates an upward trend; when ROC is less than 0, it indicates a downward trend. Stochastic RSI determines whether the market is overbought or oversold by comparing the position of RSI over a certain period.
When the price breaks above the pivot point and both ROC and Stochastic RSI confirm the trend, the strategy will open a position; when the price breaks below the pivot point and both ROC and Stochastic RSI confirm the trend, the strategy will close the position. This combination of multiple conditions can effectively filter out false signals and improve the strategy’s win rate.
Strategy Advantages
Trend tracking: By combining pivot points and momentum indicators, the strategy can effectively capture market trends and enter positions early in trend formation, maximizing profit potential.
Risk control: The strategy employs multiple conditions to filter trading signals, reducing the occurrence of false signals and thus lowering trading risk. At the same time, by setting stop-loss levels, the strategy can effectively control the maximum loss of a single trade.
High adaptability: The strategy can be applied to multiple time frames and different markets. By adjusting parameters, it can adapt to different market characteristics and trading styles.
Strategy Risks
Parameter optimization: The strategy includes multiple parameters, such as the calculation method of pivot points and the period of momentum indicators. Different parameter settings may lead to significant differences in strategy performance. Therefore, parameters need to be optimized and tested to find the best combination.
Market risk: The strategy is mainly suitable for markets with clear trends and may not perform well in choppy markets. At the same time, if the market experiences severe volatility or abnormal events, the strategy may suffer significant drawdowns.
Overfitting risk: If the strategy is overly fitted to historical data during the parameter optimization process, it may not perform well in actual trading. Therefore, it is necessary to verify the effectiveness of the strategy through out-of-sample testing and actual trading.
Strategy Optimization Direction
Dynamic parameter adjustment: Strategy parameters can be dynamically adjusted according to market conditions. For example, in choppy markets, the period of momentum indicators can be reduced to adapt to changes in market rhythm.
Adding other filtering conditions: Other technical indicators or fundamental factors can be considered as additional filtering conditions, such as trading volume and market sentiment, to further improve the reliability of signals.
Risk management optimization: The strategy’s risk-return characteristics can be improved by optimizing position management and stop-loss/take-profit rules. For example, using ATR (Average True Range) to set dynamic stop-loss levels.
Summary
The Pivot and Momentum Strategy combines pivot points and momentum indicators, focusing on trend tracking while emphasizing risk control. The strategy is applicable to multiple markets and time frames. By optimizing parameters and adding other filtering conditions, the strategy’s stability and profitability can be further improved. In practical application, attention should be paid to market risk and overfitting risk, and the effectiveness of the strategy should be ensured through continuous optimization and monitoring.
/*backtest
start: 2023-04-24 00:00:00
end: 2024-04-29 00:00:00
period: 1d
basePeriod: 1h
exchanges: [{"eid":"Futures_Binance","currency":"BTC_USDT"}]
*/

//@version=5
strategy("Pivot and Momentum", overlay=true)
//systemedic

// Pivot Hesaplama
highPrev = request.security(syminfo.tickerid, "60", high[1])
lowPrev = request.security(syminfo.tickerid, "60", low[1])
closePrev = request.security(syminfo.tickerid, "60", close[1])

pivotPoint = (highPrev + lowPrev + closePrev) / 3
R1 = 2 * pivotPoint - lowPrev
S1 = 2 * pivotPoint - highPrev

// Stochastic RSI
smoothK = input(3, "Stochastic RSI Smooth K")
smoothD = input(3, "Stochastic RSI Smooth D")
lengthRSI = input(14, "RSI Length")
lengthStoch = input(14, "Stochastic Length")
rsi = ta.rsi(close, lengthRSI)
k = ta.sma(ta.stoch(rsi, rsi, rsi, lengthStoch), smoothK)
d = ta.sma(k, smoothD)

// ROC
rocLength = input(9, "ROC Length")
roc = ta.roc(close, rocLength)

// Alım ve Satım Koşulları
longCondition = close > pivotPoint and ta.crossover(k, d) and roc > 0
shortCondition = close < pivotPoint and ta.crossunder(k, d) and roc < 0

// Pozisyon Kontrolü ve İşlem
if (longCondition)
    strategy.close("short") // Mevcut short pozisyonunu kapat
    strategy.entry("long", strategy.long, comment="Long Pozisyonu")

if (shortCondition)
    strategy.close("long") // Mevcut long pozisyonunu kapat
    strategy.entry("short", strategy.short, comment="Short Pozisyonu")

// Pivot ve Seviyeleri Çiz
plot(pivotPoint, "Pivot", color=color.red)
plot(R1, "R1", color=color.green)
plot(S1, "S1", color=color.blue)