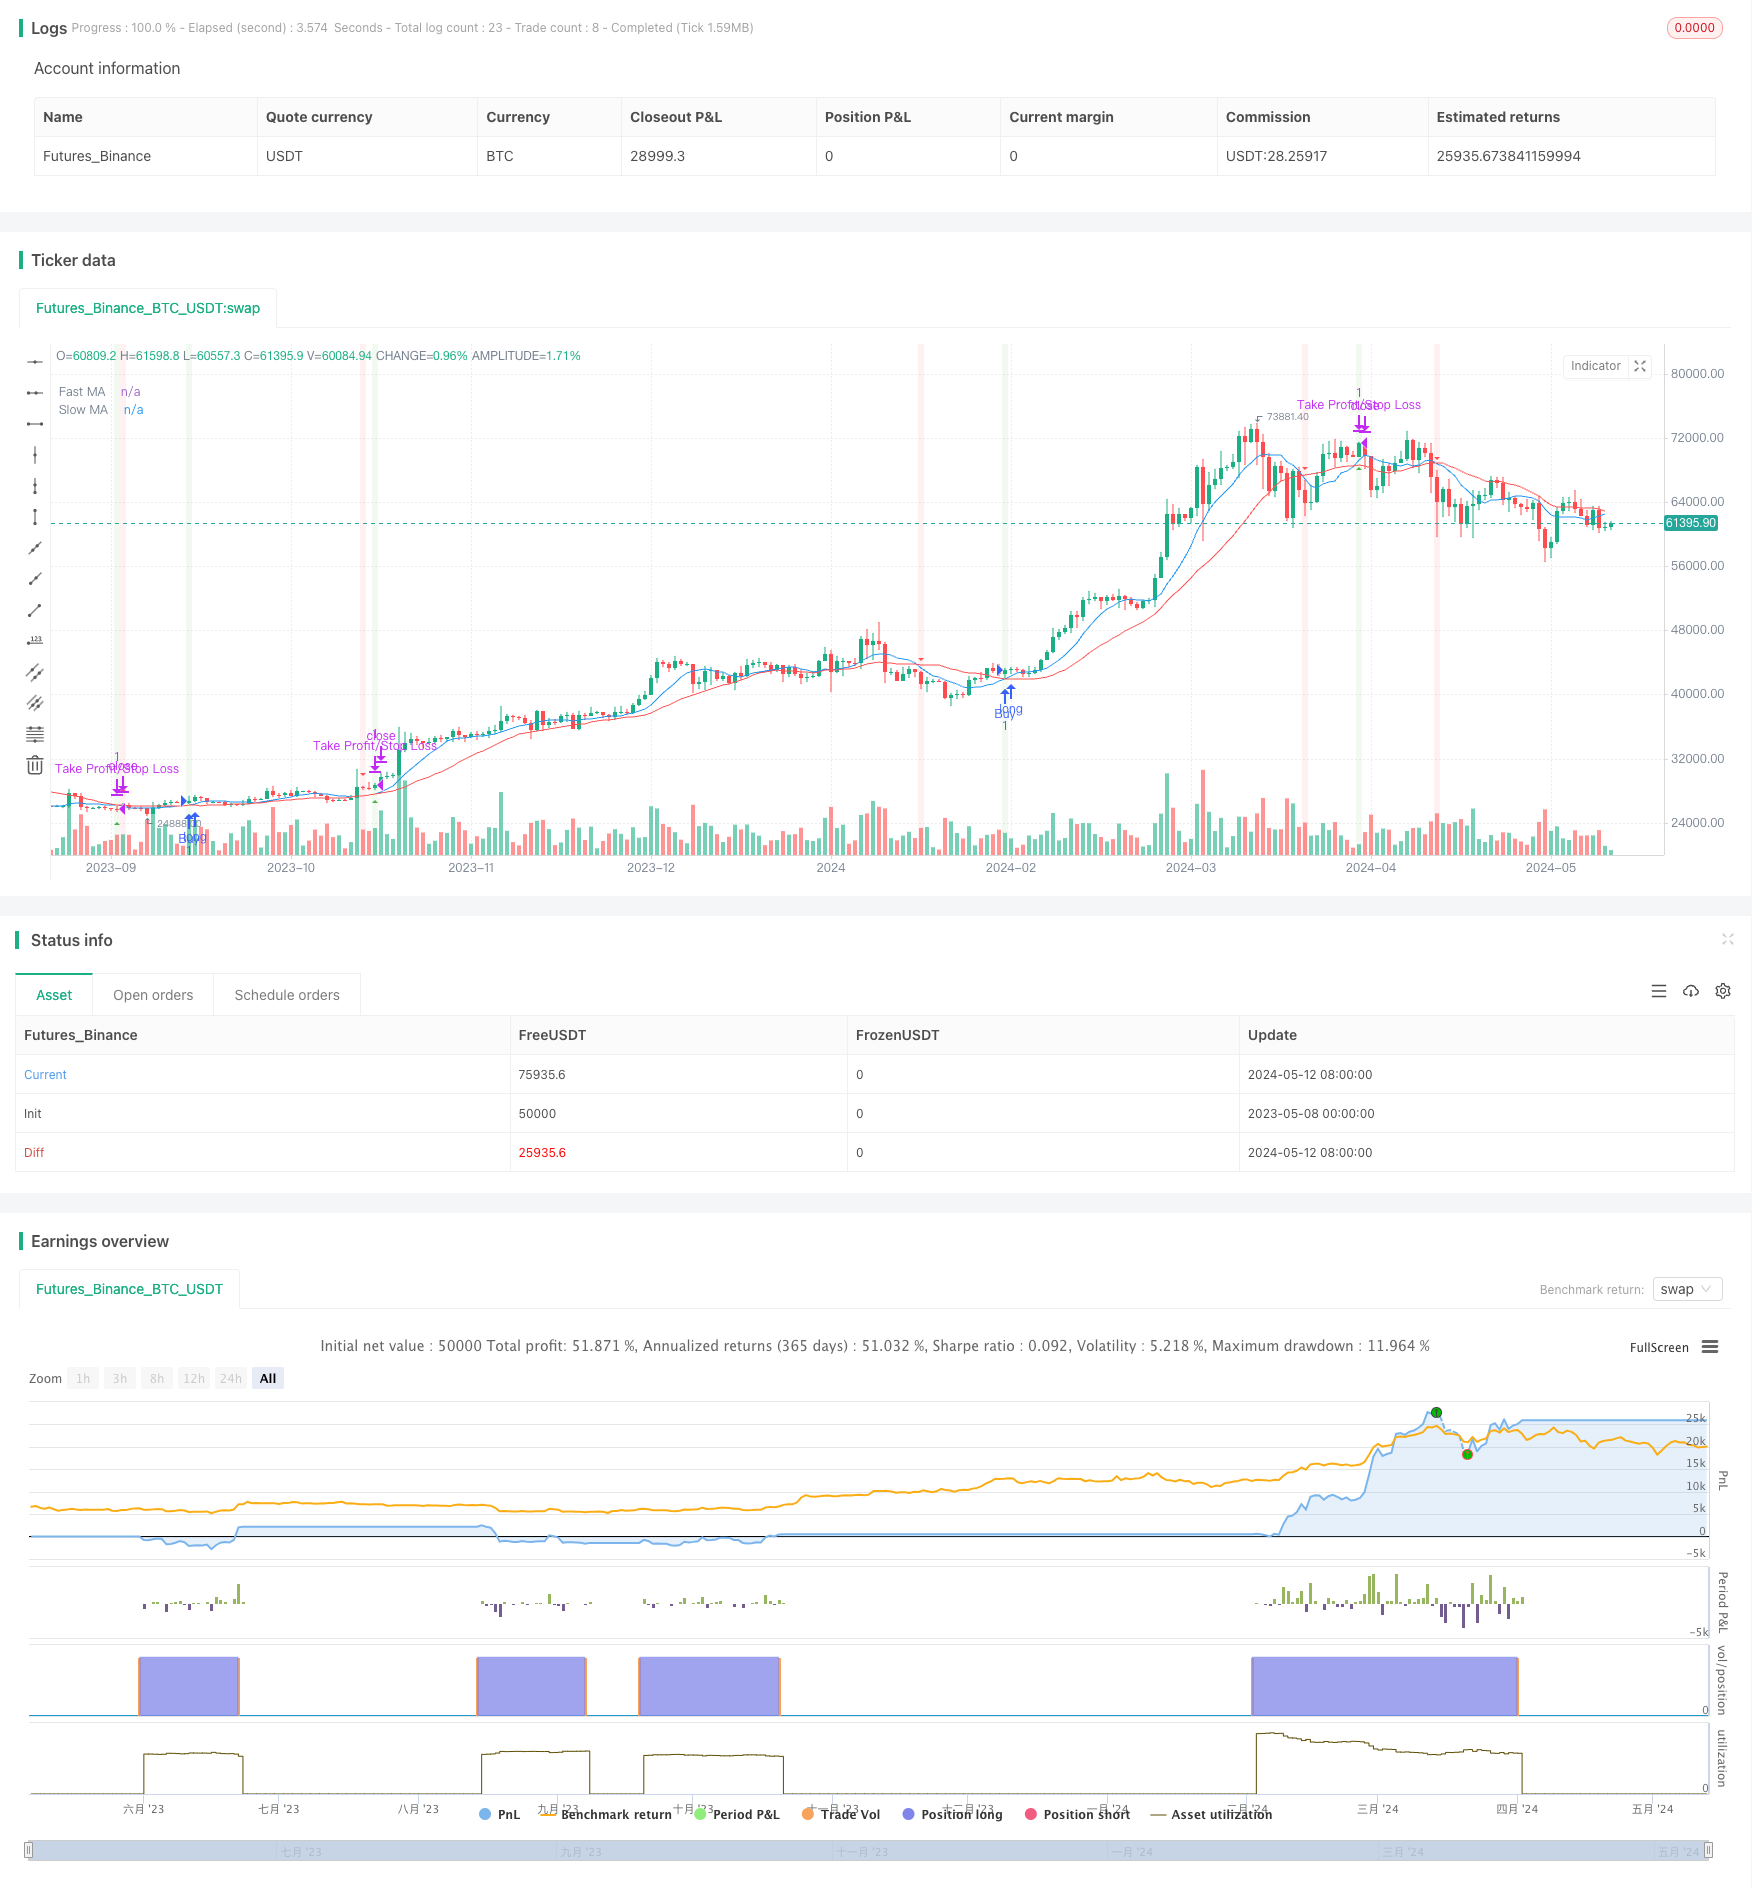
Overview
This strategy is a trading strategy based on the crossover of two simple moving averages (SMA). It calculates a fast moving average (default 9 periods) and a slow moving average (default 21 periods). A buy signal is generated when the fast moving average crosses above the slow moving average, and a sell signal is generated when the fast moving average crosses below the slow moving average. The strategy also includes stop loss and take profit features, set as percentages, to help manage risk. Additionally, the strategy can generate alerts when buy or sell signals are triggered, allowing traders to take action promptly.
Strategy Principle
The core principle of this strategy is to use the crossover relationship between two moving averages of different periods to identify potential trend changes. The fast moving average is more sensitive to price changes, while the slow moving average provides a smoother representation of the price trend. When the fast moving average crosses the slow moving average, it indicates that the price trend may have changed. Specifically:
When the fast moving average crosses above the slow moving average from below, it suggests that an uptrend may be forming, thus generating a buy signal.
When the fast moving average crosses below the slow moving average from above, it suggests that a downtrend may be forming, thus generating a sell signal.
By incorporating stop loss and take profit, the strategy aims to capture potential trend changes while managing trading risks.
Strategy Advantages
Simplicity: The strategy is based on simple moving averages, which are intuitive and easy to understand and implement.
Trend Identification: By using moving averages of different periods, the strategy can help identify potential trend changes and provide buy and sell signals to traders.
Risk Management: The built-in stop loss and take profit features can help traders manage risk by limiting potential losses and locking in profits.
Flexibility: Traders can adjust the parameters such as moving average periods, stop loss and take profit percentages according to their preferences.
Alert Feature: The strategy can generate alerts when buy or sell signals are triggered, allowing traders to take action promptly.
Strategy Risks
Lag: Moving averages are lagging indicators as they are based on historical price data. In fast-changing market conditions, signals may be delayed.
False Signals: In some cases, the fast moving average may produce multiple false crossovers with the slow moving average, leading to misleading buy or sell signals.
Failure to Identify Trends: The strategy may perform poorly in choppy markets or market conditions lacking clear trends.
Parameter Sensitivity: The performance of the strategy may be sensitive to the choice of moving average periods. Inappropriate parameter selection may lead to suboptimal results.
Strategy Optimization Directions
Parameter Optimization: Optimize and backtest the parameters such as moving average periods, stop loss, and take profit percentages to find the optimal combination.
Combining with Other Indicators: Combine the strategy with other technical indicators (e.g., Relative Strength Index, Stochastic Oscillator) to confirm trends and improve signals.
Dynamic Stop Loss and Take Profit: Implement dynamic stop loss and take profit mechanisms, such as based on Average True Range (ATR) or support/resistance levels.
Improved Risk Management: Adjust the risk percentage per trade based on individual risk preferences and market conditions. Consider changes in market volatility.
Multi-Timeframe Analysis: Analyze the strategy on different timeframes to gain a more comprehensive perspective of trends and potential trading opportunities.
Summary
The SMA Dual Moving Average Trading Strategy provides a simple yet effective approach to identify potential trend changes and generate buy and sell signals using the crossover of moving averages of different periods. By incorporating stop loss and take profit along with alert features, the strategy aims to help traders manage risk and take action in a timely manner. However, traders must be aware of the limitations of the strategy, such as the possibility of lag and false signals. The performance of the strategy can be further improved by optimizing parameters, combining with other indicators, implementing dynamic risk management measures, and analyzing on multiple timeframes. Nonetheless, it is crucial to thoroughly understand the strategy and adapt it according to individual risk preferences and market conditions before actual application.
/*backtest
start: 2023-05-08 00:00:00
end: 2024-05-13 00:00:00
period: 1d
basePeriod: 1h
exchanges: [{"eid":"Futures_Binance","currency":"BTC_USDT"}]
*/

//@version=5
strategy("Moving Average Crossover with Risk Management and Alerts", overlay=true)

// Input parameters
fast_length = input.int(9, title="Fast MA Length")
slow_length = input.int(21, title="Slow MA Length")
src = input(close, title="Source")
stop_loss_percent = input.float(1.0, title="Stop Loss (%)")
take_profit_percent = input.float(2.0, title="Take Profit (%)")
risk_per_trade_percent = input.float(2.0, title="Risk Per Trade (%)")

// Calculate moving averages
fast_ma = ta.sma(src, fast_length)
slow_ma = ta.sma(src, slow_length)

// Plot moving averages
plot(fast_ma, color=color.new(color.blue, 0), title="Fast MA")
plot(slow_ma, color=color.new(color.red, 0), title="Slow MA")

// Generate buy and sell signals
buy_signal = ta.crossover(fast_ma, slow_ma)
sell_signal = ta.crossunder(fast_ma, slow_ma)

// Plot buy and sell signals
plotshape(buy_signal, style=shape.triangleup, location=location.belowbar, color=color.new(color.green, 0), size=size.small, title="Buy Signal")
plotshape(sell_signal, style=shape.triangledown, location=location.abovebar, color=color.new(color.red, 0), size=size.small, title="Sell Signal")

// Calculate stop loss and take profit levels
stop_loss_level = strategy.position_avg_price * (1 - stop_loss_percent / 100)
take_profit_level = strategy.position_avg_price * (1 + take_profit_percent / 100)

// Risk management
if (buy_signal)
    strategy.entry("Buy", strategy.long)
    strategy.exit("Take Profit/Stop Loss", "Buy", stop=stop_loss_level, limit=take_profit_level)

// Alerts
alertcondition(buy_signal, title="Buy Signal", message="Buy Signal Detected!")
alertcondition(sell_signal, title="Sell Signal", message="Sell Signal Detected!")

// Visual enhancements
bgcolor(buy_signal ? color.new(color.green, 90) : na)
bgcolor(sell_signal ? color.new(color.red, 90) : na)