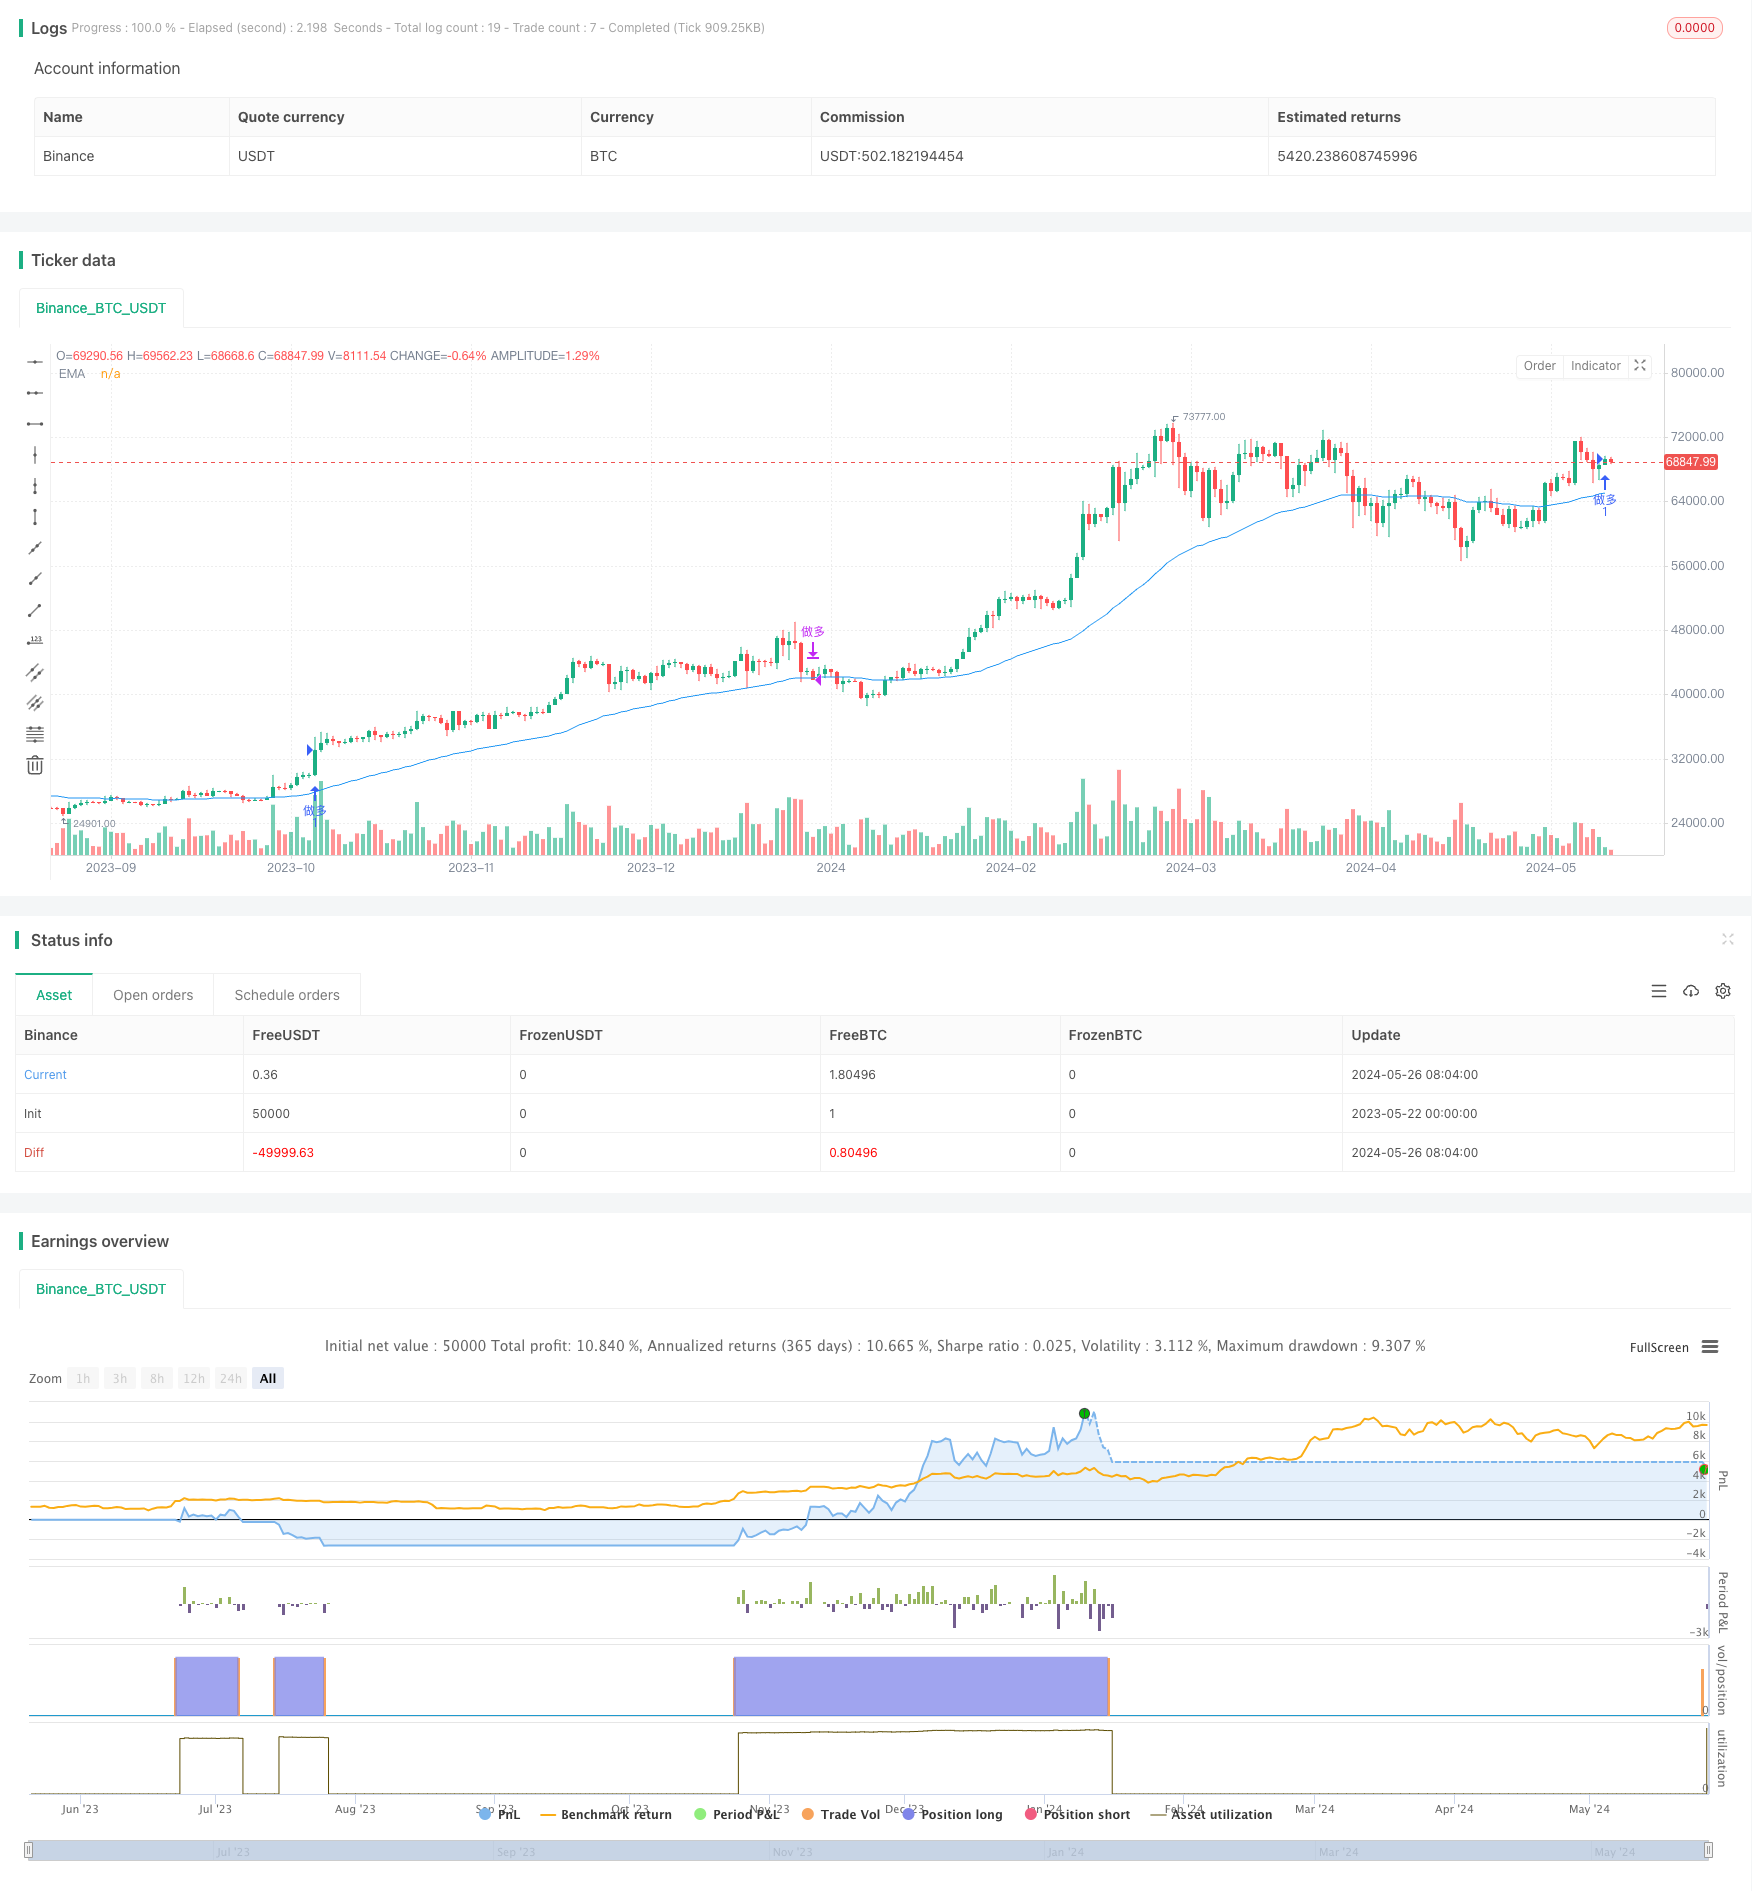
Overview
This strategy is a trend following strategy based on breakout and frequency filtering, only taking long positions. The main idea of the strategy is to use the EMA indicator to determine the current trend direction, generate a long signal when the price breaks out of the highest price within a certain range, and use a frequency filter to control the trading frequency to avoid opening positions too frequently. The strategy also sets a stop loss point to control risk and closes positions when the trend ends.
Strategy Principle
- Calculate the EMA indicator to determine the current trend direction. When the closing price is above the EMA, it is considered a bullish trend.
- Calculate the highest price within a certain range as the breakout condition. When the closing price breaks out of the highest price within the shortest or longest lookback period and the current trend is bullish, a long signal is generated.
- Introduce a frequency filter to control the minimum interval time between consecutive position openings to avoid excessive trading frequency.
- Set a stop loss point. When the price falls below the stop loss price, close the position to control risk.
- Define the trend end signal. When the closing price falls below the EMA, the trend is considered to have ended. If a long position is held at this time, close the position.
Strategy Advantages
- Trend following: By using the EMA indicator to determine the trend direction and trading in line with the trend, it helps to improve strategy returns.
- Breakout confirmation: Using price breakout as the entry signal allows for timely entry at the beginning of the trend, capturing more profit potential.
- Frequency control: Introducing a frequency filter to control the time interval between consecutive position openings avoids excessive trading and reduces trading costs and risks.
- Stop loss protection: Setting a stop loss point to promptly stop loss when the price moves in the opposite direction by a certain magnitude effectively controls downside risk.
- Dynamic position closing: Dynamically closing positions based on the trend end signal allows for timely locking in of existing profits and avoids losses caused by trend reversal.
Strategy Risks
- Parameter sensitivity: The performance of the strategy is relatively sensitive to parameter selection, and different parameter settings may lead to significant differences in strategy performance. Sufficient backtesting and optimization of parameters are required.
- Breakout failure: Price breakouts do not guarantee that the trend will definitely continue, and there may be cases of breakout failure, resulting in consecutive losses for the strategy.
- Trend recognition: The strategy relies on the EMA indicator to judge the trend, but the EMA indicator may experience lag or misjudgment, affecting the accuracy of the strategy.
- Frequent trading: Although the strategy introduces a frequency filter, frequent position opening and closing may still occur when market volatility is high, increasing trading costs.
- Stop loss risk: The setting of the stop loss point may not completely avoid the maximum drawdown of the strategy, and large losses may still occur in extreme market conditions.
Strategy Optimization Directions
- Parameter optimization: Optimize key parameters of the strategy, such as EMA length, lookback period length, stop loss percentage, etc., to find the optimal parameter combination and improve strategy stability and profitability.
- Signal filtering: After the breakout signal is generated, other technical indicators or conditions can be introduced to confirm the signal a second time, improving signal quality and reducing misjudgments and false signals.
- Trend judgment: Try using other trend judgment indicators such as MACD, DMI, etc., or combine multiple indicators to jointly judge the trend and improve the accuracy of trend recognition.
- Dynamic stop loss: Dynamically adjust the stop loss point according to market volatility conditions, such as using the ATR indicator to calculate the dynamic stop loss price or introducing a trailing stop loss strategy to better control risk.
- Position management: Optimize the position management strategy, dynamically adjust the position size according to market volatility and account capital conditions, control the risk exposure of a single transaction, and improve capital utilization efficiency.
Summary
This strategy is a trend following strategy based on breakout and frequency filtering. It uses the EMA indicator to determine the trend direction, uses price breakout as the entry signal, introduces a frequency filter to control the trading frequency, and sets a stop loss point to control risk. The advantages of the strategy lie in trend following, breakout confirmation, frequency control, stop loss protection, and dynamic position closing, but it also has potential risks such as parameter sensitivity, breakout failure, trend recognition, frequent trading, and stop loss risk. To further optimize the strategy, we can start from aspects such as parameter optimization, signal filtering, trend judgment, dynamic stop loss, and position management to improve the stability and profitability of the strategy.
/*backtest
start: 2023-05-22 00:00:00
end: 2024-05-27 00:00:00
period: 1d
basePeriod: 1h
exchanges: [{"eid":"Binance","currency":"BTC_USDT"}]
*/

//@version=5
strategy("Trend Following with Breakout and Frequency Filter (Long Only)", overlay=true)

// 输入参数
emaLength = input.int(50, title="EMA长度")
lookbackPeriodMin = input.int(80, title="最短回溯期")
lookbackPeriodMax = input.int(120, title="最长回溯期")
stopLossPct = input.float(2, title="止损百分比") / 100  // 止损百分比
minHoldBars = input.int(10, title="最小持仓K线数量")  // 最小持仓K线数量

// 计算EMA
ema = ta.ema(close, emaLength)

// 计算最高价和最低价
highestHigh = ta.highest(high, lookbackPeriodMax)
lowestLow = ta.lowest(low, lookbackPeriodMax)

// 定义趋势方向
isBullish = close > ema

// 定义突破信号
breakoutCondition = (ta.crossover(close, highestHigh[lookbackPeriodMin]) or ta.crossover(close, highestHigh[lookbackPeriodMax])) and isBullish

// 计算止损点
stopLossLevelLong = close * (1 - stopLossPct)

// 绘制EMA
plot(ema, title="EMA", color=color.blue)

// 记录上次开仓时间
var float lastEntryTime = na

// 策略执行并标注信号
if (breakoutCondition and (na(lastEntryTime) or (time - lastEntryTime) > minHoldBars * timeframe.multiplier))
    strategy.entry("做多", strategy.long)
    label.new(bar_index, high, text="买入", style=label.style_label_up, color=color.green, textcolor=color.white)
    strategy.exit("止损", from_entry="做多", stop=stopLossLevelLong)
    lastEntryTime := time

// 定义趋势结束信号
exitCondition = close < ema

if (exitCondition and (strategy.position_size > 0) and (time - lastEntryTime) > minHoldBars * timeframe.multiplier)
    strategy.close("做多")
    label.new(bar_index, low, text="卖出", style=label.style_label_down, color=color.red, textcolor=color.white)