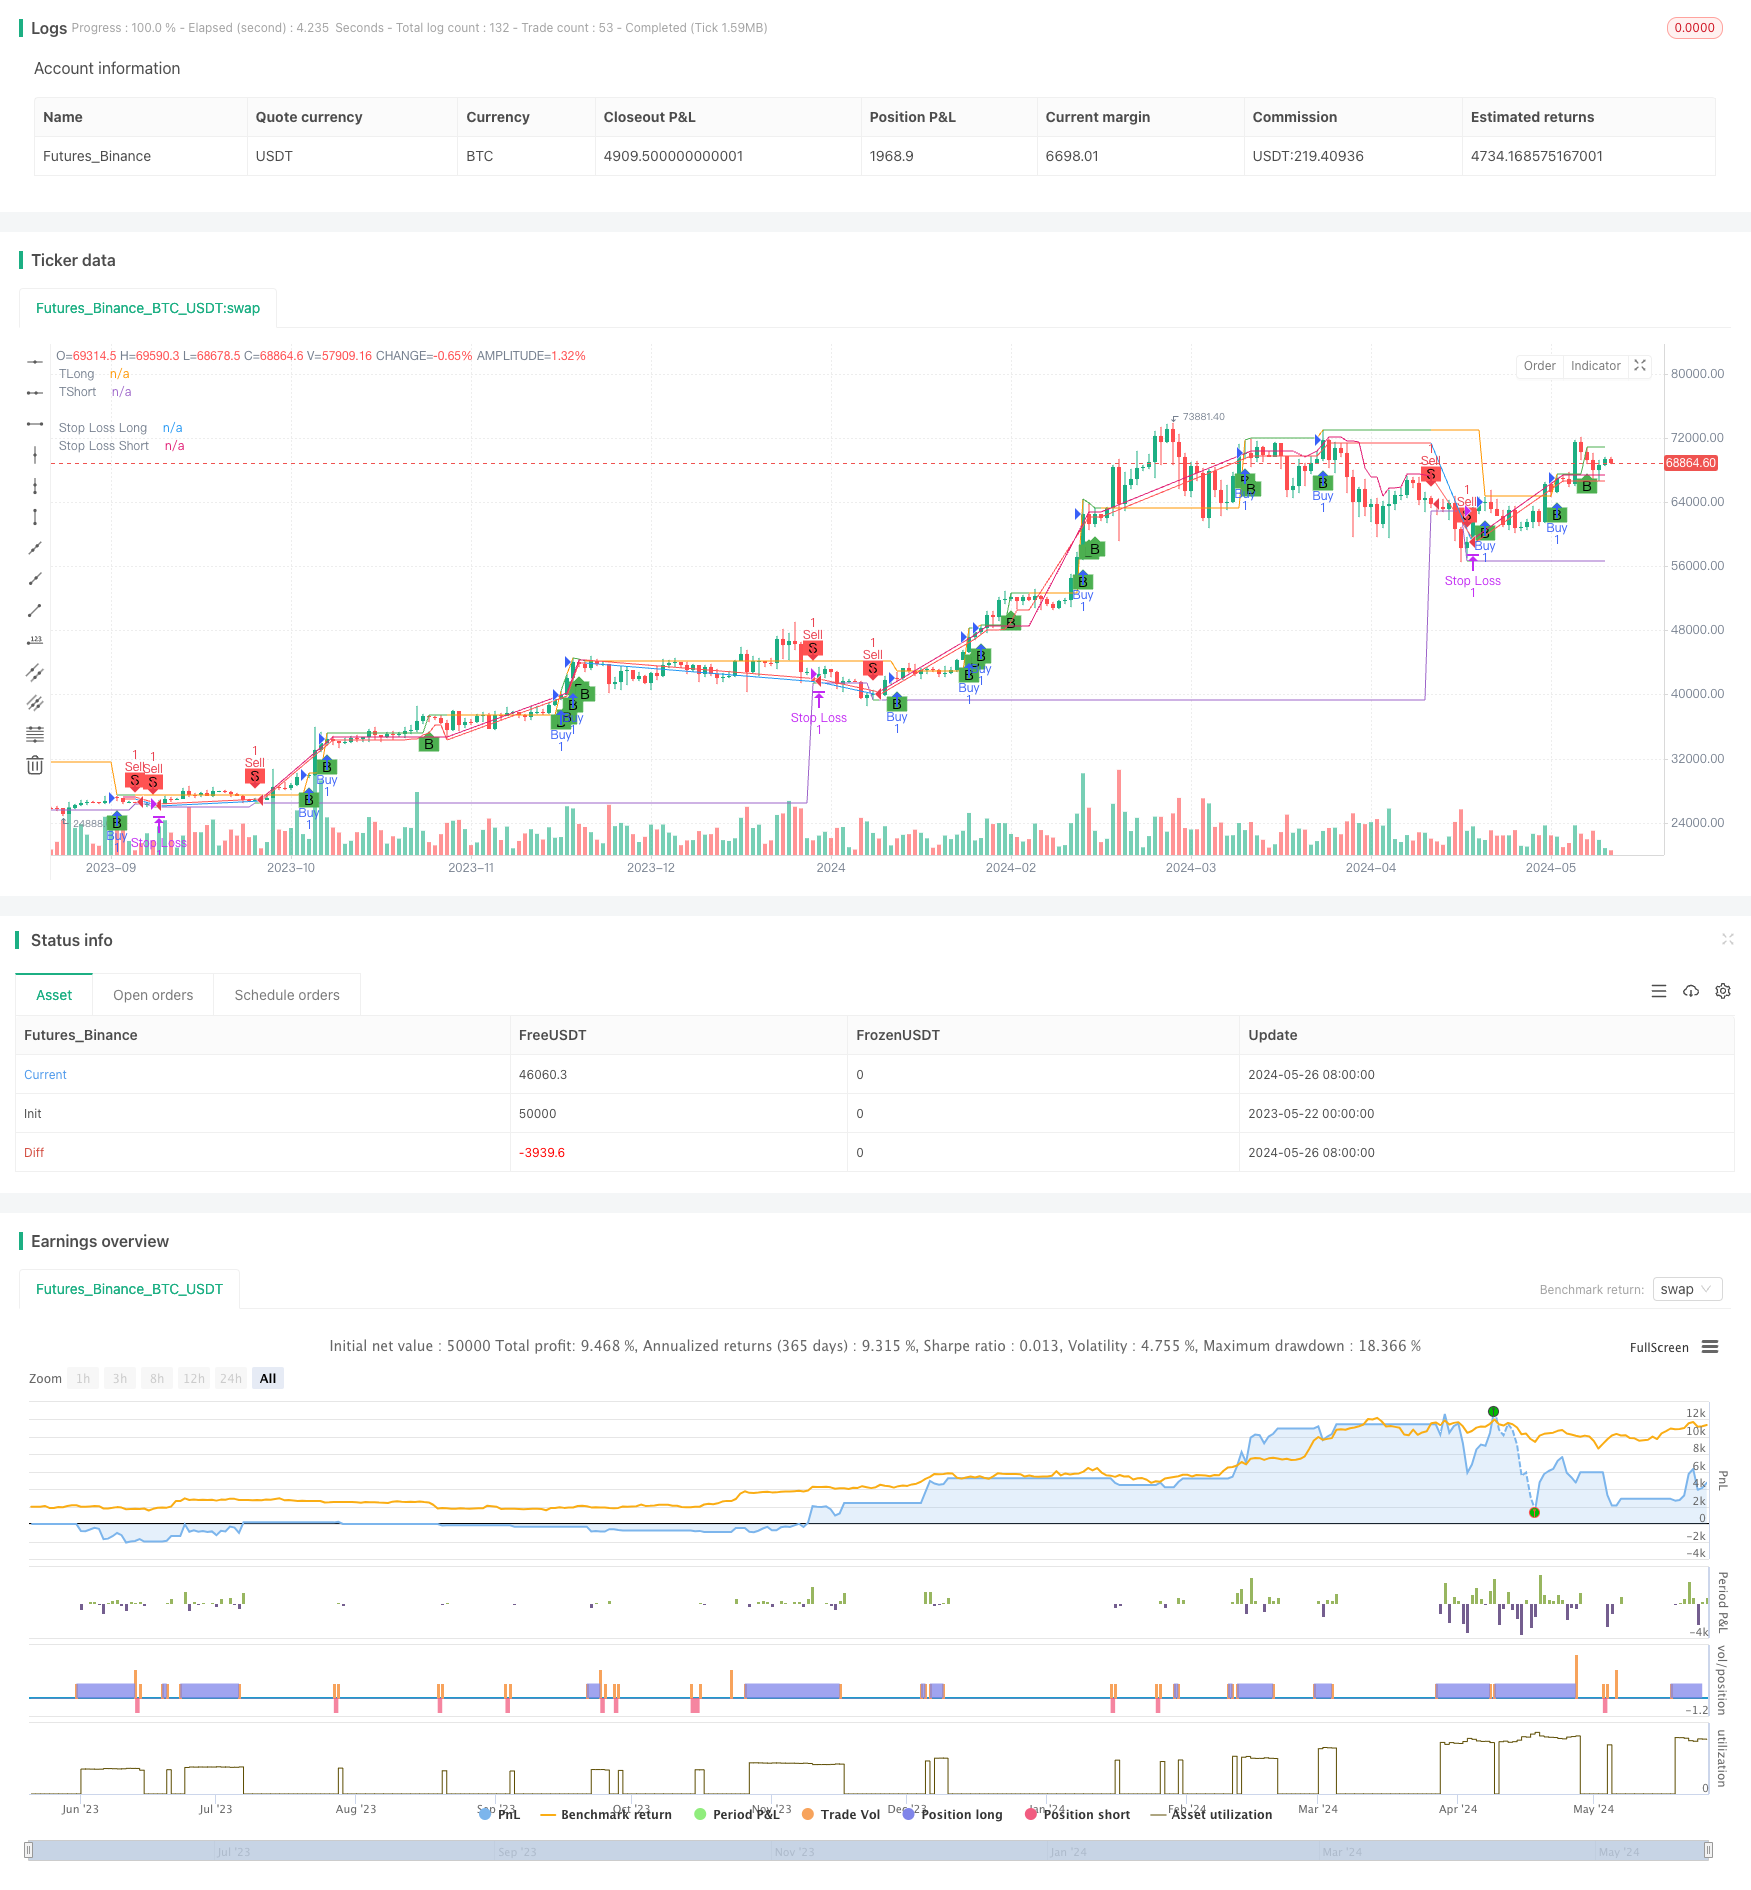
Overview
This strategy is an FVG-based momentum scalping strategy. It identifies potential short-term trading opportunities in the market by recognizing bullish and bearish signals from the FVG indicator. The strategy employs tight stop losses and profit targets to limit potential losses and maximize gains. It is designed for short-term time frames (e.g., 1-minute or 5-minute charts).
Strategy Principle
The strategy utilizes the FVG indicator to identify potential trading opportunities. The FVG indicator determines bullish and bearish signals by comparing the current closing price with the highest and lowest prices of the previous three candles. If the current closing price is higher than the highest price of the previous three candles, a bullish signal is triggered. Conversely, if the current closing price is lower than the lowest price of the previous three candles, a bearish signal is triggered.
Once a trading signal is determined, the strategy executes buy or sell orders at the midpoint of the FVG range. For long trades, the stop loss is set 1% below the FVG low, and the profit target is set 2% above the FVG high. For short trades, the stop loss is set 1% above the FVG high, and the profit target is set 2% below the FVG low.
Strategy Advantages
The strategy employs a simple yet effective FVG indicator to identify potential trading opportunities. The FVG indicator is capable of capturing short-term price momentum, aiding in trading during the early stages of trend formation.
The strategy utilizes tight stop losses and profit targets to limit potential losses and maximize gains. This helps manage risk and improve overall profitability.
The strategy is suitable for short-term time frames, taking advantage of short-term fluctuations in the market. This allows the strategy to quickly adapt to changing market conditions.
Strategy Risks
The strategy relies on trading signals provided by the FVG indicator. While the FVG indicator is effective in capturing price momentum, it does not guarantee success in every trade. False signals may lead to losing trades.
The strategy uses fixed stop losses and profit targets. Although this helps manage risk, it may also limit potential gains. During strong trends, prices may extend beyond the predefined profit targets.
Scalping strategies face high trading frequency and costs. Frequent trading can generate significant slippage and commissions, impacting overall profitability.
Strategy Optimization Directions
Consider incorporating dynamic stop losses and profit targets into the strategy. Adjusting stop losses and profit targets based on market volatility and trend strength can better adapt to different market conditions.
Combine other technical indicators (e.g., moving averages or relative strength index) with the FVG indicator to provide additional confirmation and filtering. This can help reduce false signals and improve trading accuracy.
Backtest and optimize the strategy to determine optimal parameter settings (e.g., FVG period, stop loss and profit target percentages). Fine-tuning these parameters can enhance the overall performance of the strategy.
Summary
In summary, the FVG Momentum Scalping Strategy is a simple yet effective strategy that captures price momentum within short-term time frames using the FVG indicator. By employing tight stop losses and profit targets, the strategy manages risk and maximizes gains. However, the strategy also faces risks such as false signals, fixed stop losses and profit targets, and high trading frequency. To further optimize the strategy, consider implementing dynamic stop losses and profit targets, combining with other technical indicators, and optimizing strategy parameters. With these improvements, the FVG Momentum Scalping Strategy can become a more robust and reliable trading tool.
/*backtest
start: 2023-05-22 00:00:00
end: 2024-05-27 00:00:00
period: 1d
basePeriod: 1h
exchanges: [{"eid":"Futures_Binance","currency":"BTC_USDT"}]
*/

//@version=5
strategy("ScalpingStrategy", overlay=true)

// Define the FVG calculation
fvgLow = ta.lowest(low, 3)
fvgHigh = ta.highest(high, 3)

var float entrySL=0
// Define the Bullish and Bearish FVG conditions
bullishFVG = low[1] > high[3]
bearishFVG = high[1] < low[3]

// Define the mid-point of the FVG range
fvgMid = (fvgLow + fvgHigh) / 2

// Define the buy and sell conditions
buyCondition = bullishFVG and close >= fvgMid and low<=fvgHigh
sellCondition = bearishFVG and close <= fvgMid and high>=fvgLow

// Plot buy and sell signals
plotshape(buyCondition, style=shape.labelup, location=location.belowbar, color=color.green, text="B")
plotshape(sellCondition, style=shape.labeldown, location=location.abovebar, color=color.red, text="S")

// Execute buy and sell orders
var float targetLong = 0
var float targetShort = 0

if (buyCondition)
    strategy.entry("Buy", strategy.long)
    targetLong := high * 1.0012 // Calculate target price 2% above high
    strategy.exit("Target", "Buy", limit=targetLong)
    entrySL=fvgLow*0.994

if (sellCondition)
    strategy.entry("Sell", strategy.short)
    targetShort := low * 0.994 // Calculate target price 2% below low
    strategy.exit("Target", "Sell", limit=targetShort)
    entrySL=fvgHigh*1.0028


// Trailing stoploss
//stopLossLong = fvgLow * 0.997 // strategy.position_avg_price * 0.995
//stopLossShort = fvgHigh * 1.003 // strategy.position_avg_price * 1.005
stopLossLong = math.max(fvgLow * 0.997, strategy.position_avg_price * 0.995)
stopLossShort = math.min(fvgHigh * 1.003, strategy.position_avg_price * 1.005)


// Plot stoploss lines with small length
plot(stopLossLong, title="Stop Loss Long", color= strategy.position_size > 0 ? color.red : na, linewidth=1)
plot(stopLossShort, title="Stop Loss Short", color= strategy.position_size < 0 ? color.red : na, linewidth=1)

plot(targetLong, title="TLong", color= strategy.position_size > 0 ? color.green : na,  linewidth=1)
plot(targetShort, title="TShort",color= strategy.position_size < 0 ? color.green : na,  linewidth=1)

// Exit with stoploss
strategy.exit("Stop Loss", "Buy", stop=stopLossLong)
strategy.exit("Stop Loss", "Sell", stop=stopLossShort)