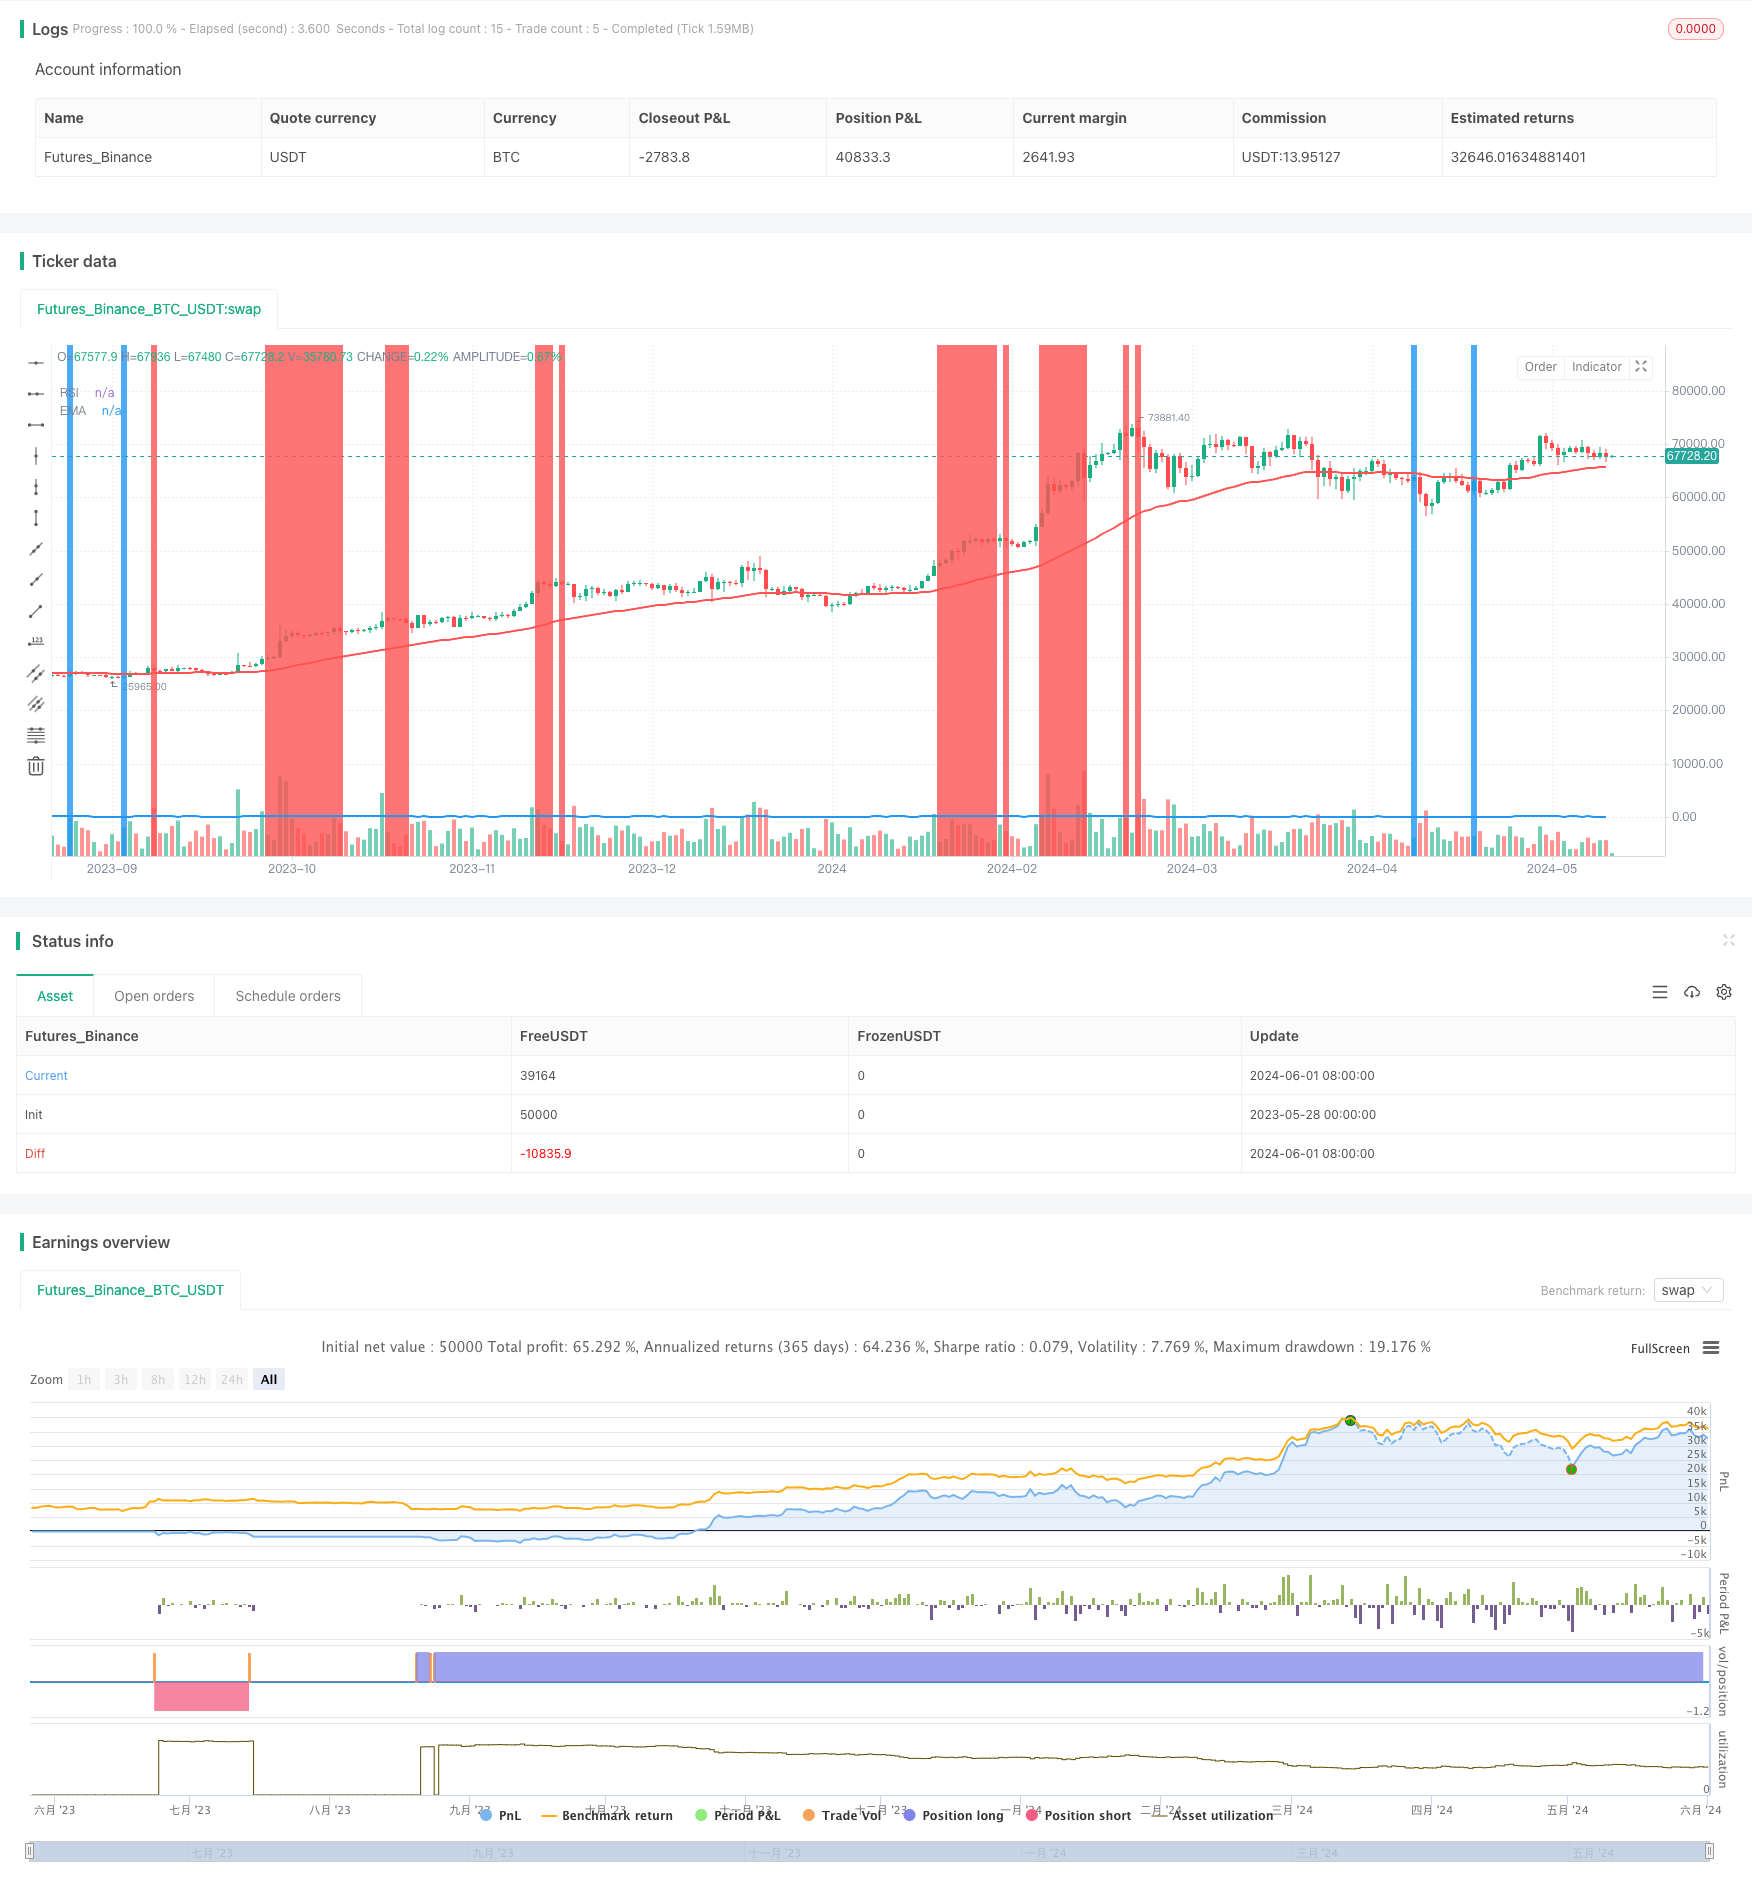
Overview
The EMA RSI Crossover strategy combines the Exponential Moving Average (EMA) and Relative Strength Index (RSI) technical indicators to identify potential buy or sell signals. When the EMA and RSI lines intersect, indicating a crossover, it suggests a potential change in market momentum. For instance, a bullish crossover occurs when the shorter EMA crosses above the longer EMA, accompanied by the RSI crossing above a certain threshold, signaling a potential uptrend. Conversely, a bearish crossover indicates a potential downtrend when the shorter EMA crosses below the longer EMA, with the RSI crossing below a specified level. Traders often use this strategy to enter or exit positions based on these crossover signals, aiming to capitalize on trends and market reversals.
Strategy Principles
- Calculate the RSI indicator value for the specified period and plot it on the chart.
- Calculate the EMA indicator value for the specified period and plot it on the chart.
- Consider it a buy signal when the price is below the EMA and the RSI is less than 20; consider it a sell signal when the price is above the EMA and the RSI is greater than 80.
- When a buy signal appears and the current candle’s close price is higher than the previous candle’s, open a long position; when a sell signal appears and the current candle’s close price is lower than the previous candle’s, open a short position.
- Use the Average True Range (ATR) to calculate stop loss and take profit levels. The stop loss level is the entry price minus (ATR + candle body length), and the take profit level is the entry price plus (1.2 * (ATR + candle body length)).
Strategy Advantages
- Combines the trend-following EMA indicator and the momentum-based RSI indicator for a more comprehensive assessment of market trends.
- Can generate trading signals early in the formation of a trend, helping to capture trend opportunities promptly.
- Uses ATR to dynamically adjust stop loss and take profit distances, better adapting to market volatility.
- Considers both the relationship between price and indicators and the candlestick patterns, improving the reliability of signals.
Strategy Risks
- Both EMA and RSI indicators have a certain degree of lag, which may lead to false signals where the indicators cross but the price does not immediately reverse.
- The RSI indicator frequently generates crossover signals in range-bound markets, potentially leading to overtrading.
- Fixed RSI thresholds may not be suitable for all market conditions and may require adjustment based on market characteristics.
- The strategy heavily relies on ATR for calculating stop loss and take profit, but ATR values may be distorted by sudden large price fluctuations.
Strategy Optimization Directions
- Optimize the parameters of EMA and RSI to find the most suitable combination for the current market.
- Add other filtering conditions in range-bound markets, such as changes in trading volume or volatility, to filter out frequent false signals.
- Make adaptive adjustments to the upper and lower thresholds of RSI to adapt to different market states.
- Employ multiple stop loss and take profit methods, such as stop loss and take profit based on support and resistance levels, or trailing stop loss based on trend direction, to improve risk control capabilities.
- Incorporate a position sizing module to dynamically adjust the position size of each trade based on market volatility and account risk status.
Summary
The EMA RSI Crossover strategy is a simple and easy-to-use trend-following strategy that combines indicators from both trend and momentum dimensions to comprehensively assess market direction. The strategy also employs some filtering conditions and dynamic stop loss and take profit methods to improve signal quality and risk control capabilities. However, the strategy has some limitations, such as indicator lag and frequent trading. Therefore, in practical application, it is necessary to further optimize and improve the strategy based on specific market characteristics and personal risk preferences.
/*backtest
start: 2023-05-28 00:00:00
end: 2024-06-02 00:00:00
period: 1d
basePeriod: 1h
exchanges: [{"eid":"Futures_Binance","currency":"BTC_USDT"}]
*/

// This Pine Script™ code is subject to the terms of the Mozilla Public License 2.0 at https://mozilla.org/MPL/2.0/
// © pritom980

//@version=5
strategy("EMA RSI Cross", overlay=true, margin_long=100, margin_short=100)

// add RSI

rsi_period = input.int(7,"RSI Period")
rsi_val =  ta.rsi(close[1],rsi_period)
plot(rsi_val, color=color.blue, linewidth=2, title="RSI")

buyRsiFlag = rsi_val < 20
sellRsiFlag = rsi_val > 80

// add EMA
ema = ta.ema(close, 50)
plot(ema, color=color.red, linewidth=2, title="EMA")


// check buy

// buy when the price is below ema
buyFlag = ema > close ? true : false

// sell when the price is above ema
sellFlag = ema < close ? true : false


bgcolor(buyFlag and buyRsiFlag ? color.green : na )
bgcolor(sellFlag and sellRsiFlag ? color.red : na )


// Check if current candle's body is bigger than previous candle's body and of opposite color
is_body_bigger_long = math.abs(close - open) > math.abs(close[1] - open[1]) and close > open != close[1] > open[1]


greenCandle = close > close[1]
redCandle = close < close[1]
// Mark the candle
bgcolor(is_body_bigger_long and greenCandle and buyFlag  ? color.blue : na, transp=70)


// ENTRY ---------------------

// Input for ATR period
atr_length = input(14, title="ATR Length")

// Calculate ATR
atr_value = ta.atr(atr_length)

// Calculate stop loss and take profit levels
candleBody = math.abs(close-open)
slDist = atr_value + candleBody

stop_loss_long = close - slDist
take_profit_long = close + (1.2 * slDist)


stop_loss_short = high + slDist
take_profit_short = high - (1.2 * slDist)

// Entry and exit conditions
if (buyFlag and buyRsiFlag  and strategy.opentrades >= 0 and greenCandle)
    strategy.entry("Long", strategy.long)
    strategy.exit("Take Profit/Stop Loss", "Long", stop=stop_loss_long, limit=take_profit_long)

// Entry and exit conditions
if (sellFlag and sellRsiFlag   and strategy.opentrades <= 0 and redCandle)
    strategy.entry("Short", strategy.short)
    strategy.exit("Take Profit/Stop Loss", "Short", stop=stop_loss_short, limit=take_profit_short)