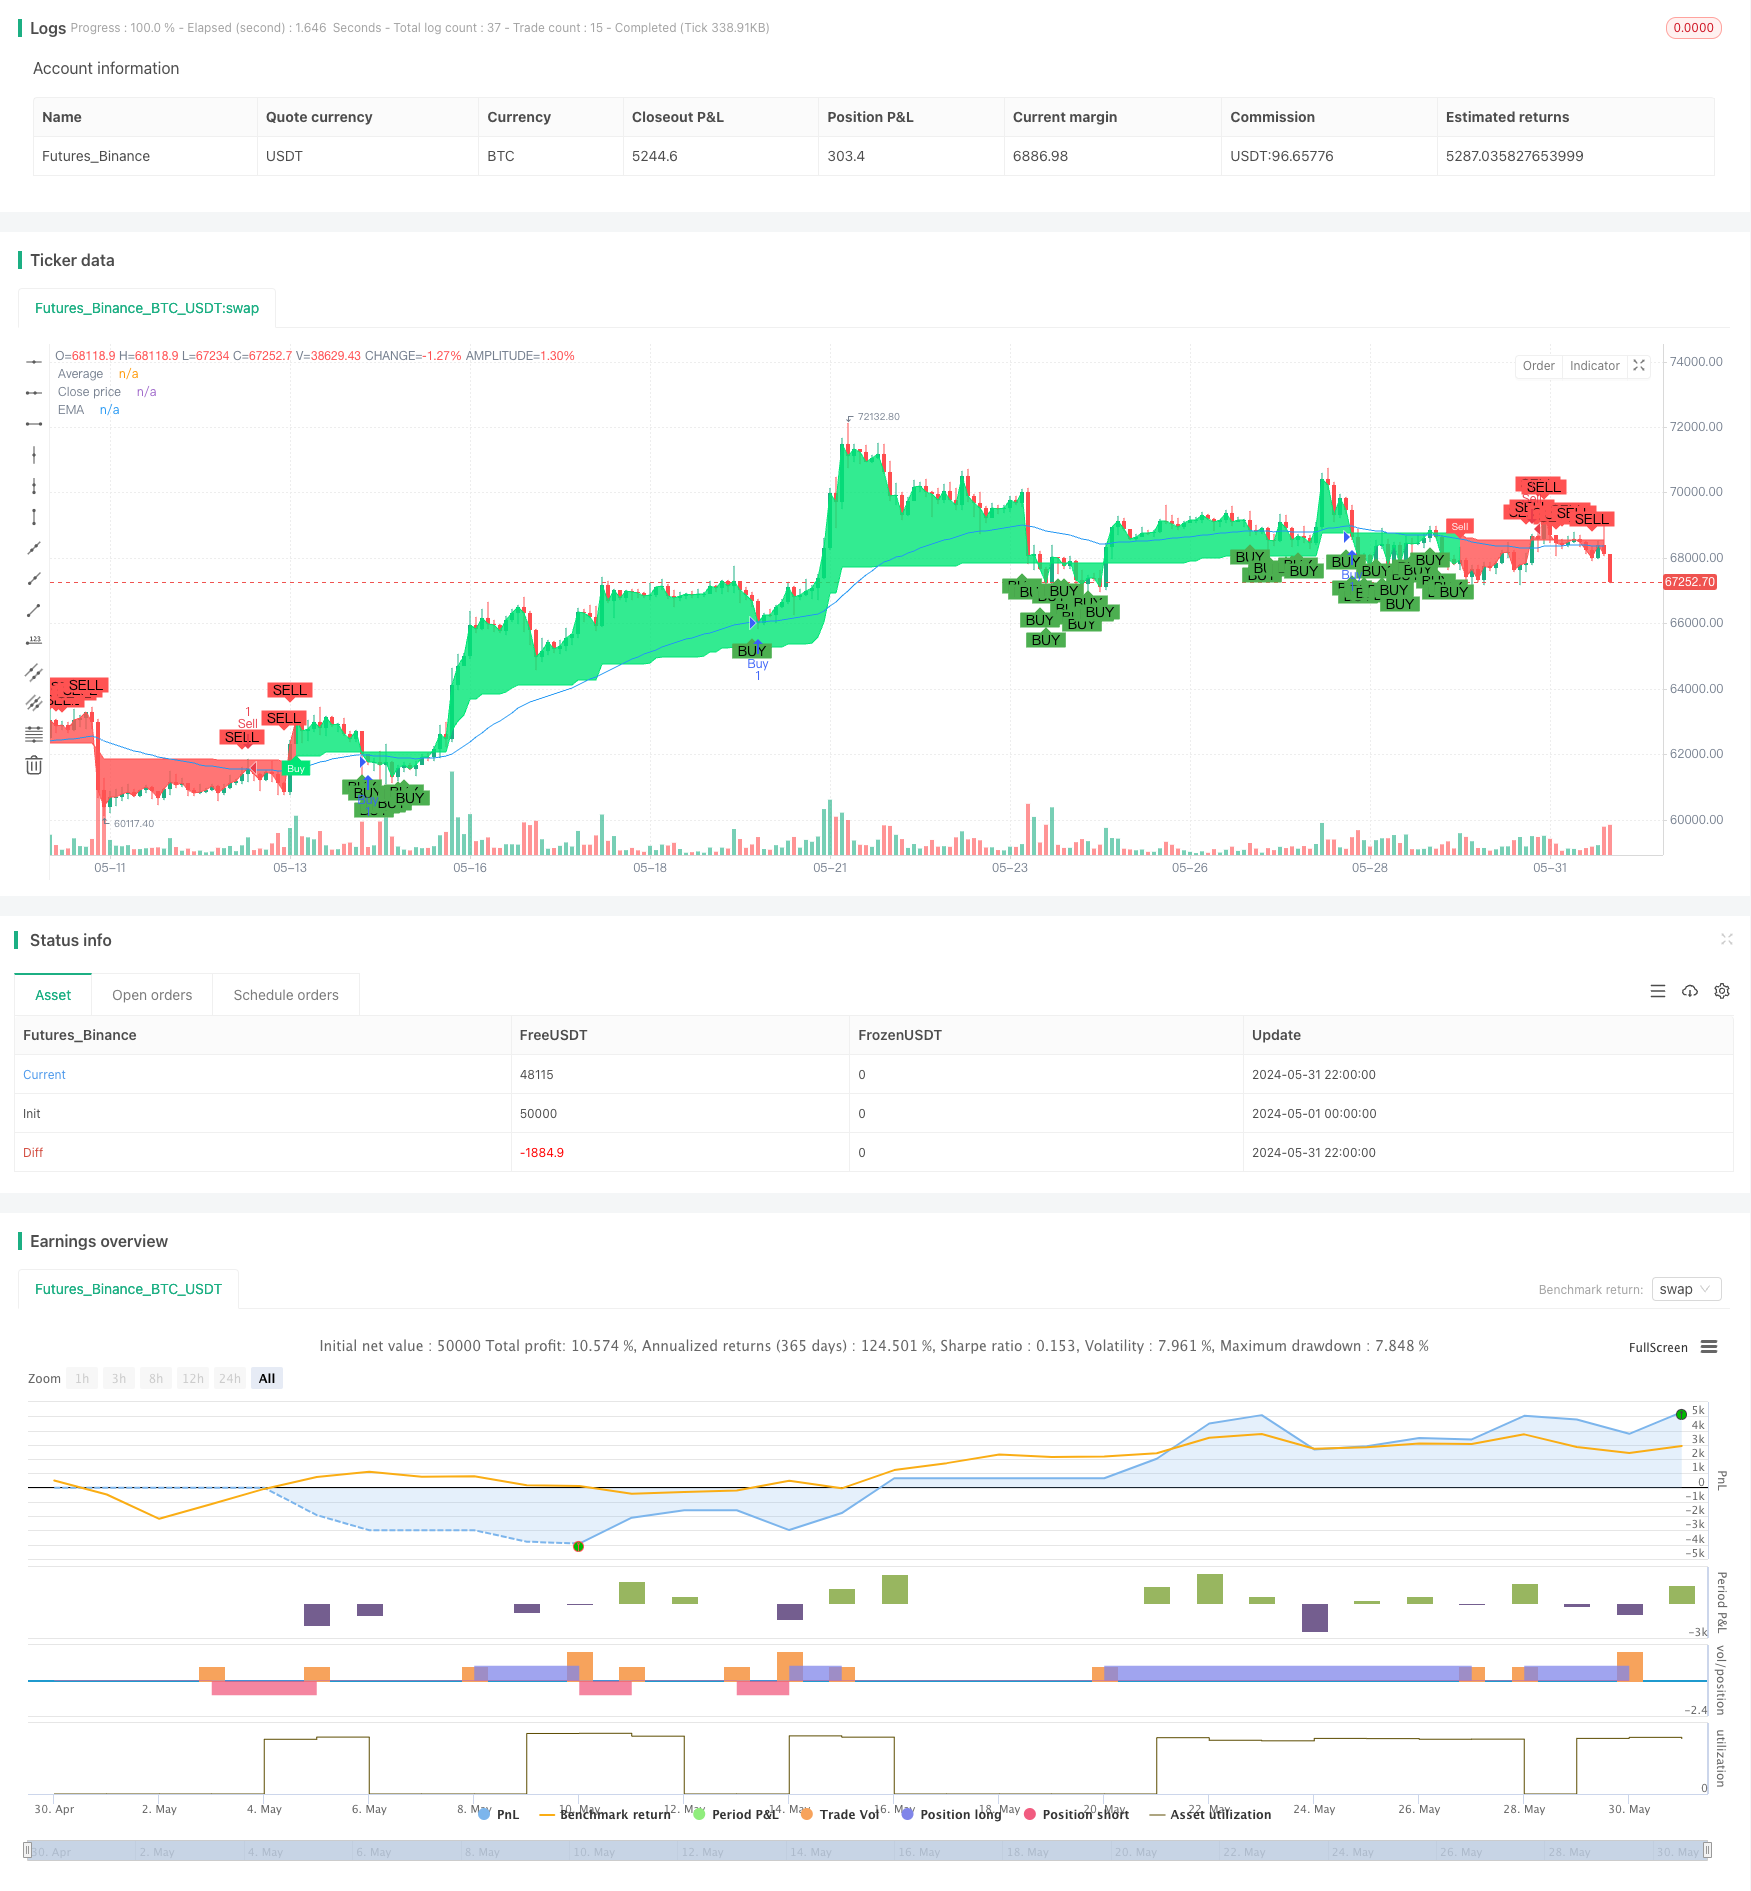
Overview
This strategy utilizes the G-Channel indicator to identify the trend direction of the market, while incorporating EMA and ATR indicators to optimize entry and exit points. The main idea is: go long when the price breaks above the upper band of the G-Channel and is below the EMA; go short when the price breaks below the lower band and is above the EMA. Meanwhile, ATR is used to set dynamic stop-loss and take-profit levels, with the stop-loss at 2 times ATR and take-profit at 4 times ATR. This approach can capture more profits in trending markets while strictly controlling risks.
Strategy Principles
- Calculate G-Channel upper and lower bands: use the current close price and previous high and low prices to calculate the upper and lower bands of the G-Channel.
- Determine trend direction: observe the relationship between price and the G-Channel bands to determine bullish or bearish trend.
- Calculate EMA: calculate the EMA value for the specified period.
- Calculate ATR: calculate the ATR value for the specified period.
- Determine buy/sell conditions: trigger a long position when price breaks above the upper band and is below EMA; trigger a short position when price breaks below the lower band and is above EMA.
- Set stop-loss and take-profit: stop-loss is entry price - 2*ATR, take-profit is entry price + 4*ATR (long); stop-loss is entry price + 2*ATR, take-profit is entry price - 4*ATR (short).
- Strategy execution: when buy/sell conditions are met, execute the corresponding entry operation and set the stop-loss and take-profit accordingly.
Strategy Advantages
- Trend following: the strategy effectively captures market trends using the G-Channel, suitable for trending markets.
- Dynamic stop-loss and take-profit: ATR is used to dynamically adjust stop-loss and take-profit levels, better adapting to market volatility.
- Risk control: stop-loss is set at 2 times ATR, strictly controlling the risk of each trade.
- Simple and easy to use: the strategy logic is clear and straightforward, suitable for most investors.
Strategy Risks
- Ranging markets: in ranging markets, frequent trading signals may lead to increased losses.
- Parameter optimization: different trading instruments and timeframes may require different parameters; blindly applying may bring risks.
- Black swan events: in extreme market conditions with drastic price fluctuations, stop-losses may fail to execute effectively.
Strategy Optimization Directions
- Trend filtering: add trend filtering conditions such as MA crossover, DMI, etc., to reduce trading in ranging markets.
- Parameter optimization: optimize parameters for different instruments and timeframes to find the best parameter combination.
- Position management: dynamically adjust positions based on market volatility to improve capital utilization.
- Strategy combination: combine this strategy with other effective strategies to improve stability.
Summary
This strategy constructs a simple and effective trend-following trading system using indicators such as G-Channel, EMA, and ATR. It can achieve good results in trending markets, but performs average in ranging markets. Going forward, the strategy can be optimized in terms of trend filtering, parameter optimization, position management, strategy combination, etc., to further enhance the robustness and profitability of the strategy.
/*backtest
start: 2024-05-01 00:00:00
end: 2024-05-31 23:59:59
period: 2h
basePeriod: 15m
exchanges: [{"eid":"Futures_Binance","currency":"BTC_USDT"}]
*/

//@version=4
// Full credit to AlexGrover: https://www.tradingview.com/script/fIvlS64B-G-Channels-Efficient-Calculation-Of-Upper-Lower-Extremities/
strategy ("G-Channel Trend Detection with EMA Strategy and ATR", shorttitle="G-Trend EMA ATR Strategy", overlay=true)

// Inputs for G-Channel
length = input(100, title="G-Channel Length")
src = input(close, title="Source")

// G-Channel Calculation
var float a = na
var float b = na
a := max(src, nz(a[1])) - (nz(a[1] - b[1]) / length)
b := min(src, nz(b[1])) + (nz(a[1] - b[1]) / length)
avg = (a + b) / 2

// G-Channel Signals
crossup = b[1] < close[1] and b > close
crossdn = a[1] < close[1] and a > close
bullish = barssince(crossdn) <= barssince(crossup)
c = bullish ? color.lime : color.red

// Plot G-Channel Average
p1 = plot(avg, "Average", color=c, linewidth=1, transp=90)
p2 = plot(close, "Close price", color=c, linewidth=1, transp=100)
fill(p1, p2, color=c, transp=90)

// Show Buy/Sell Labels
showcross = input(true, title="Show Buy/Sell Labels")
plotshape(showcross and not bullish and bullish[1] ? avg : na, location=location.absolute, style=shape.labeldown, color=color.red, size=size.tiny, text="Sell", textcolor=color.white, transp=0, offset=-1)
plotshape(showcross and bullish and not bullish[1] ? avg : na, location=location.absolute, style=shape.labelup, color=color.lime, size=size.tiny, text="Buy", textcolor=color.white, transp=0, offset=-1)

// Inputs for EMA
emaLength = input(50, title="EMA Length")
emaValue = ema(close, emaLength)

// Plot EMA
plot(emaValue, title="EMA", color=color.blue, linewidth=1)

// ATR Calculation
atrLength = input(14, title="ATR Length")
atrValue = atr(atrLength)

// Strategy Conditions
buyCondition = bullish and close < emaValue
sellCondition = not bullish and close > emaValue

// Stop Loss and Take Profit Levels
longStopLoss = close - 2 * atrValue
longTakeProfit = close + 4 * atrValue
shortStopLoss = close + 2 * atrValue
shortTakeProfit = close - 4 * atrValue

// Execute Strategy with ATR-based stop loss and take profit
if (buyCondition)
    strategy.entry("Buy", strategy.long)
    strategy.exit("Sell", "Buy", stop=longStopLoss, limit=longTakeProfit)

if (sellCondition)
    strategy.entry("Sell", strategy.short)
    strategy.exit("Cover", "Sell", stop=shortStopLoss, limit=shortTakeProfit)

// Plot Buy/Sell Signals on the chart
plotshape(series=buyCondition, location=location.belowbar, color=color.green, style=shape.labelup, text="BUY", offset=-1)
plotshape(series=sellCondition, location=location.abovebar, color=color.red, style=shape.labeldown, text="SELL", offset=-1)