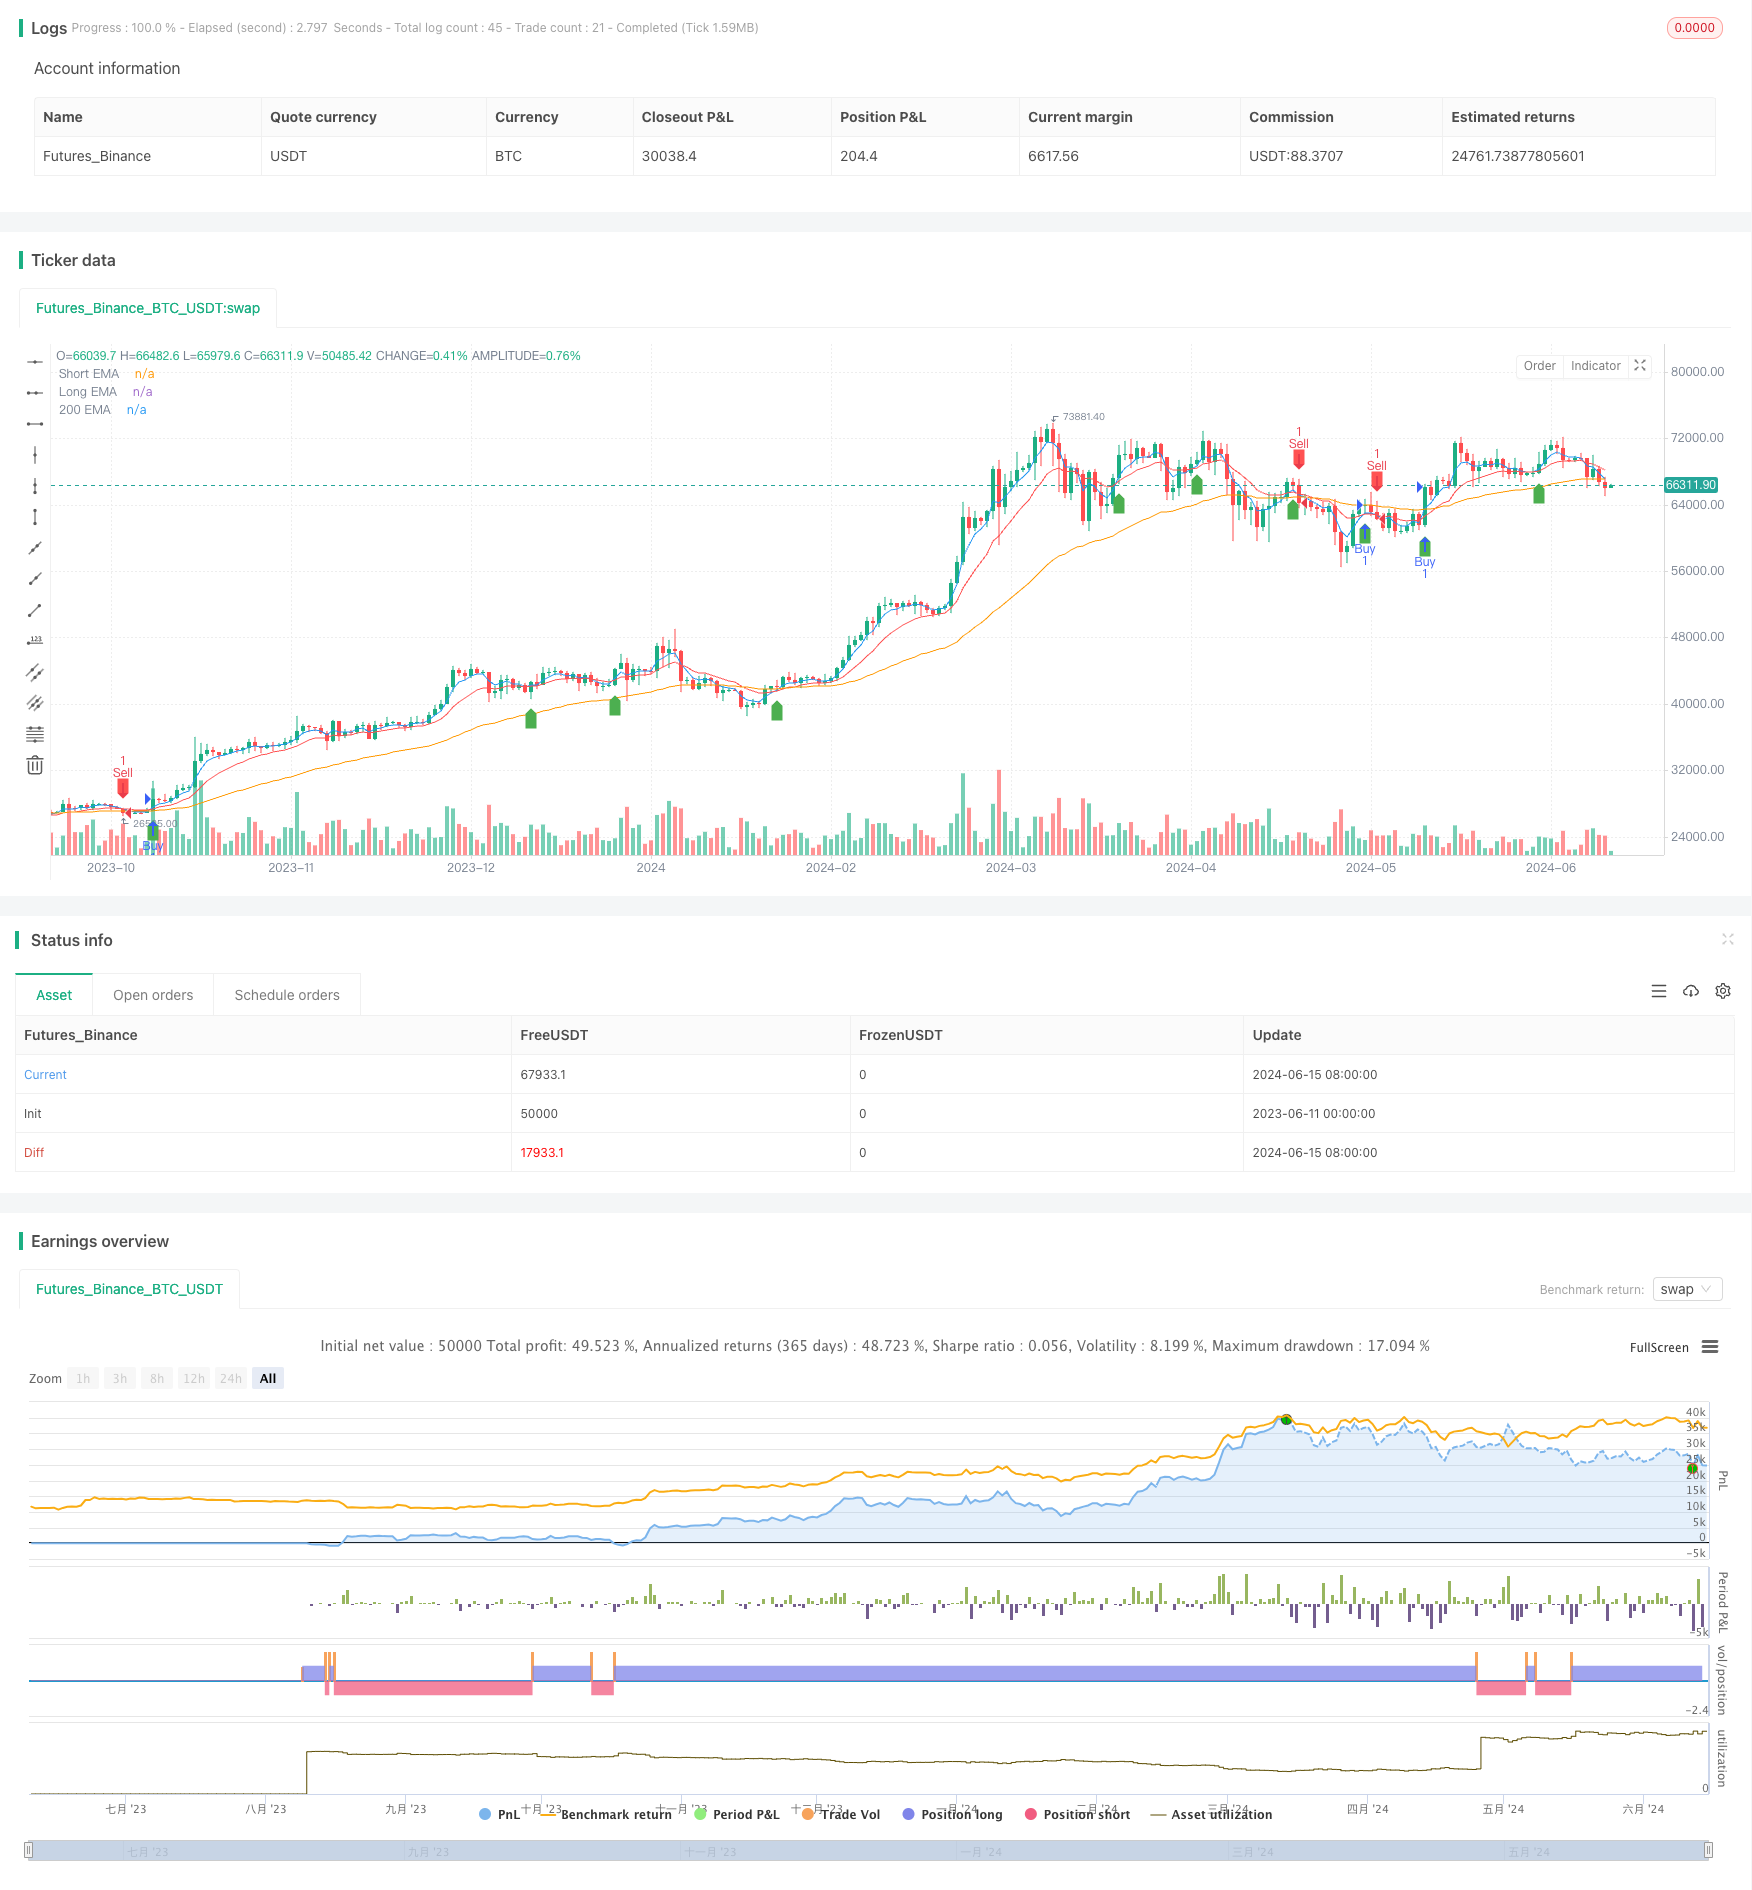
Overview
This strategy combines multiple technical indicators, including three Exponential Moving Averages (EMAs) with different periods and the Relative Strength Index (RSI), to identify potential buy and sell signals by analyzing the relationships between these indicators. The main idea behind this strategy is to use the crossovers of short-term, medium-term, and long-term EMAs to determine the trend direction while using RSI to filter out possible false signals. A buy signal is generated when the price is above the long-term EMA, the short-term EMA crosses above the medium-term EMA, and the RSI is not in the overbought area. Conversely, a sell signal is generated when the price is below the long-term EMA, the short-term EMA crosses below the medium-term EMA, and the RSI is not in the oversold area.
Strategy Principles
- Calculate three EMAs with different periods: short-term (default 4), medium-term (default 12), and long-term (default 48).
- Calculate the RSI indicator with a default period of 14, overbought level of 70, and oversold level of 30.
- A buy signal is generated when the following conditions are met:
- The short-term EMA crosses above the medium-term EMA
- The RSI is not in the overbought area
- The closing price is above the long-term EMA
- A sell signal is generated when the following conditions are met:
- The short-term EMA crosses below the medium-term EMA
- The RSI is not in the oversold area
- The closing price is below the long-term EMA
- Execute corresponding long or short trades based on the buy and sell signals.
Strategy Advantages
- Multiple indicator confirmation: This strategy combines trend-following indicators (EMAs) and a momentum indicator (RSI), using confirmation from multiple indicators to improve signal reliability and help filter out some false signals.
- Trend adaptability: By using EMAs with different periods, this strategy can adapt to trends on various time scales, capturing short-term, medium-term, and long-term trend changes.
- Risk control: By incorporating overbought and oversold conditions from the RSI, this strategy avoids trading when the market may be prone to reversals, controlling risk to a certain extent.
- Simplicity and ease of use: The strategy’s logic is clear, and the indicators used are simple and practical, making it easy to understand and apply.
Strategy Risks
- Parameter optimization risk: The performance of this strategy depends on the selection of EMA and RSI parameters, and different parameters may lead to varying results. If the parameters are not sufficiently backtested and optimized, the strategy’s performance may be suboptimal.
- Choppy market risk: In choppy market conditions, frequent EMA crossovers may generate excessive trading signals, increasing trading costs and reducing strategy efficiency.
- Trend reversal risk: This strategy generates signals after a trend has been established, potentially missing out on some profits in the early stages of a trend. Additionally, when a trend suddenly reverses, the strategy may not react quickly enough, leading to potential losses.
Strategy Optimization Directions
- Dynamic parameter optimization: Consider using dynamic parameter optimization methods, such as genetic algorithms or grid search, to find the best-performing parameter combinations under different market conditions, improving the strategy’s adaptability and robustness.
- Additional filtering conditions: To further enhance signal quality, consider incorporating other technical indicators or market sentiment indicators as filtering conditions, such as volume or volatility.
- Trend strength confirmation: Before generating trading signals, analyze trend strength (e.g., using the ADX indicator) to confirm the reliability of the trend, avoiding trades in weak or trendless markets.
- Stop-loss and take-profit optimization: Introduce more advanced stop-loss and take-profit strategies, such as trailing stops or volatility-based dynamic stops, to better control risk and protect profits.
Summary
This strategy combines three EMAs with different periods and the RSI indicator to form a simple and effective trend-following trading system. It uses EMA crossovers to identify trend direction and RSI to filter out potential false signals, capturing trends while controlling risk. Although the strategy has some limitations, such as parameter optimization risk and trend reversal risk, further optimizations, including dynamic parameter selection, additional filtering conditions, and improved stop-loss and take-profit strategies, can enhance its adaptability and robustness, making it a more comprehensive and reliable trading system.
/*backtest
start: 2023-06-11 00:00:00
end: 2024-06-16 00:00:00
period: 1d
basePeriod: 1h
exchanges: [{"eid":"Futures_Binance","currency":"BTC_USDT"}]
*/

// This Pine Script™ code is subject to the terms of the Mozilla Public License 2.0 at https://mozilla.org/MPL/2.0/
// © fitradn
//@version=4
//@version=4
strategy("EMA & RSI Strategy with 200 EMA", shorttitle="EMARSI200", overlay=true)

// Input for EMAs
shortEmaLength = input(4, title="Short EMA Length")
longEmaLength = input(12, title="Long EMA Length")
longTermEmaLength = input(48, title="Long Term EMA Length")

// Calculate EMAs
shortEma = ema(close, shortEmaLength)
longEma = ema(close, longEmaLength)
longTermEma = ema(close, longTermEmaLength)

// Plot EMAs
plot(shortEma, color=color.blue, title="Short EMA")
plot(longEma, color=color.red, title="Long EMA")
plot(longTermEma, color=color.orange, title="200 EMA")

// Input for RSI
rsiLength = input(14, title="RSI Length")
overbought = input(70, title="Overbought Level")
oversold = input(30, title="Oversold Level")

// Calculate RSI
rsi = rsi(close, rsiLength)

// Buy and Sell Conditions
buySignal = crossover(shortEma, longEma) and rsi < overbought and close > longTermEma
sellSignal = crossunder(shortEma, longEma) and rsi > oversold and close < longTermEma

// Execute Trades
if (buySignal)
    strategy.entry("Buy", strategy.long)
if (sellSignal)
    strategy.entry("Sell", strategy.short)

// Plot Buy and Sell Signals
plotshape(series=buySignal, location=location.belowbar, color=color.green, style=shape.labelup, title="Buy Signal")
plotshape(series=sellSignal, location=location.abovebar, color=color.red, style=shape.labeldown, title="Sell Signal")