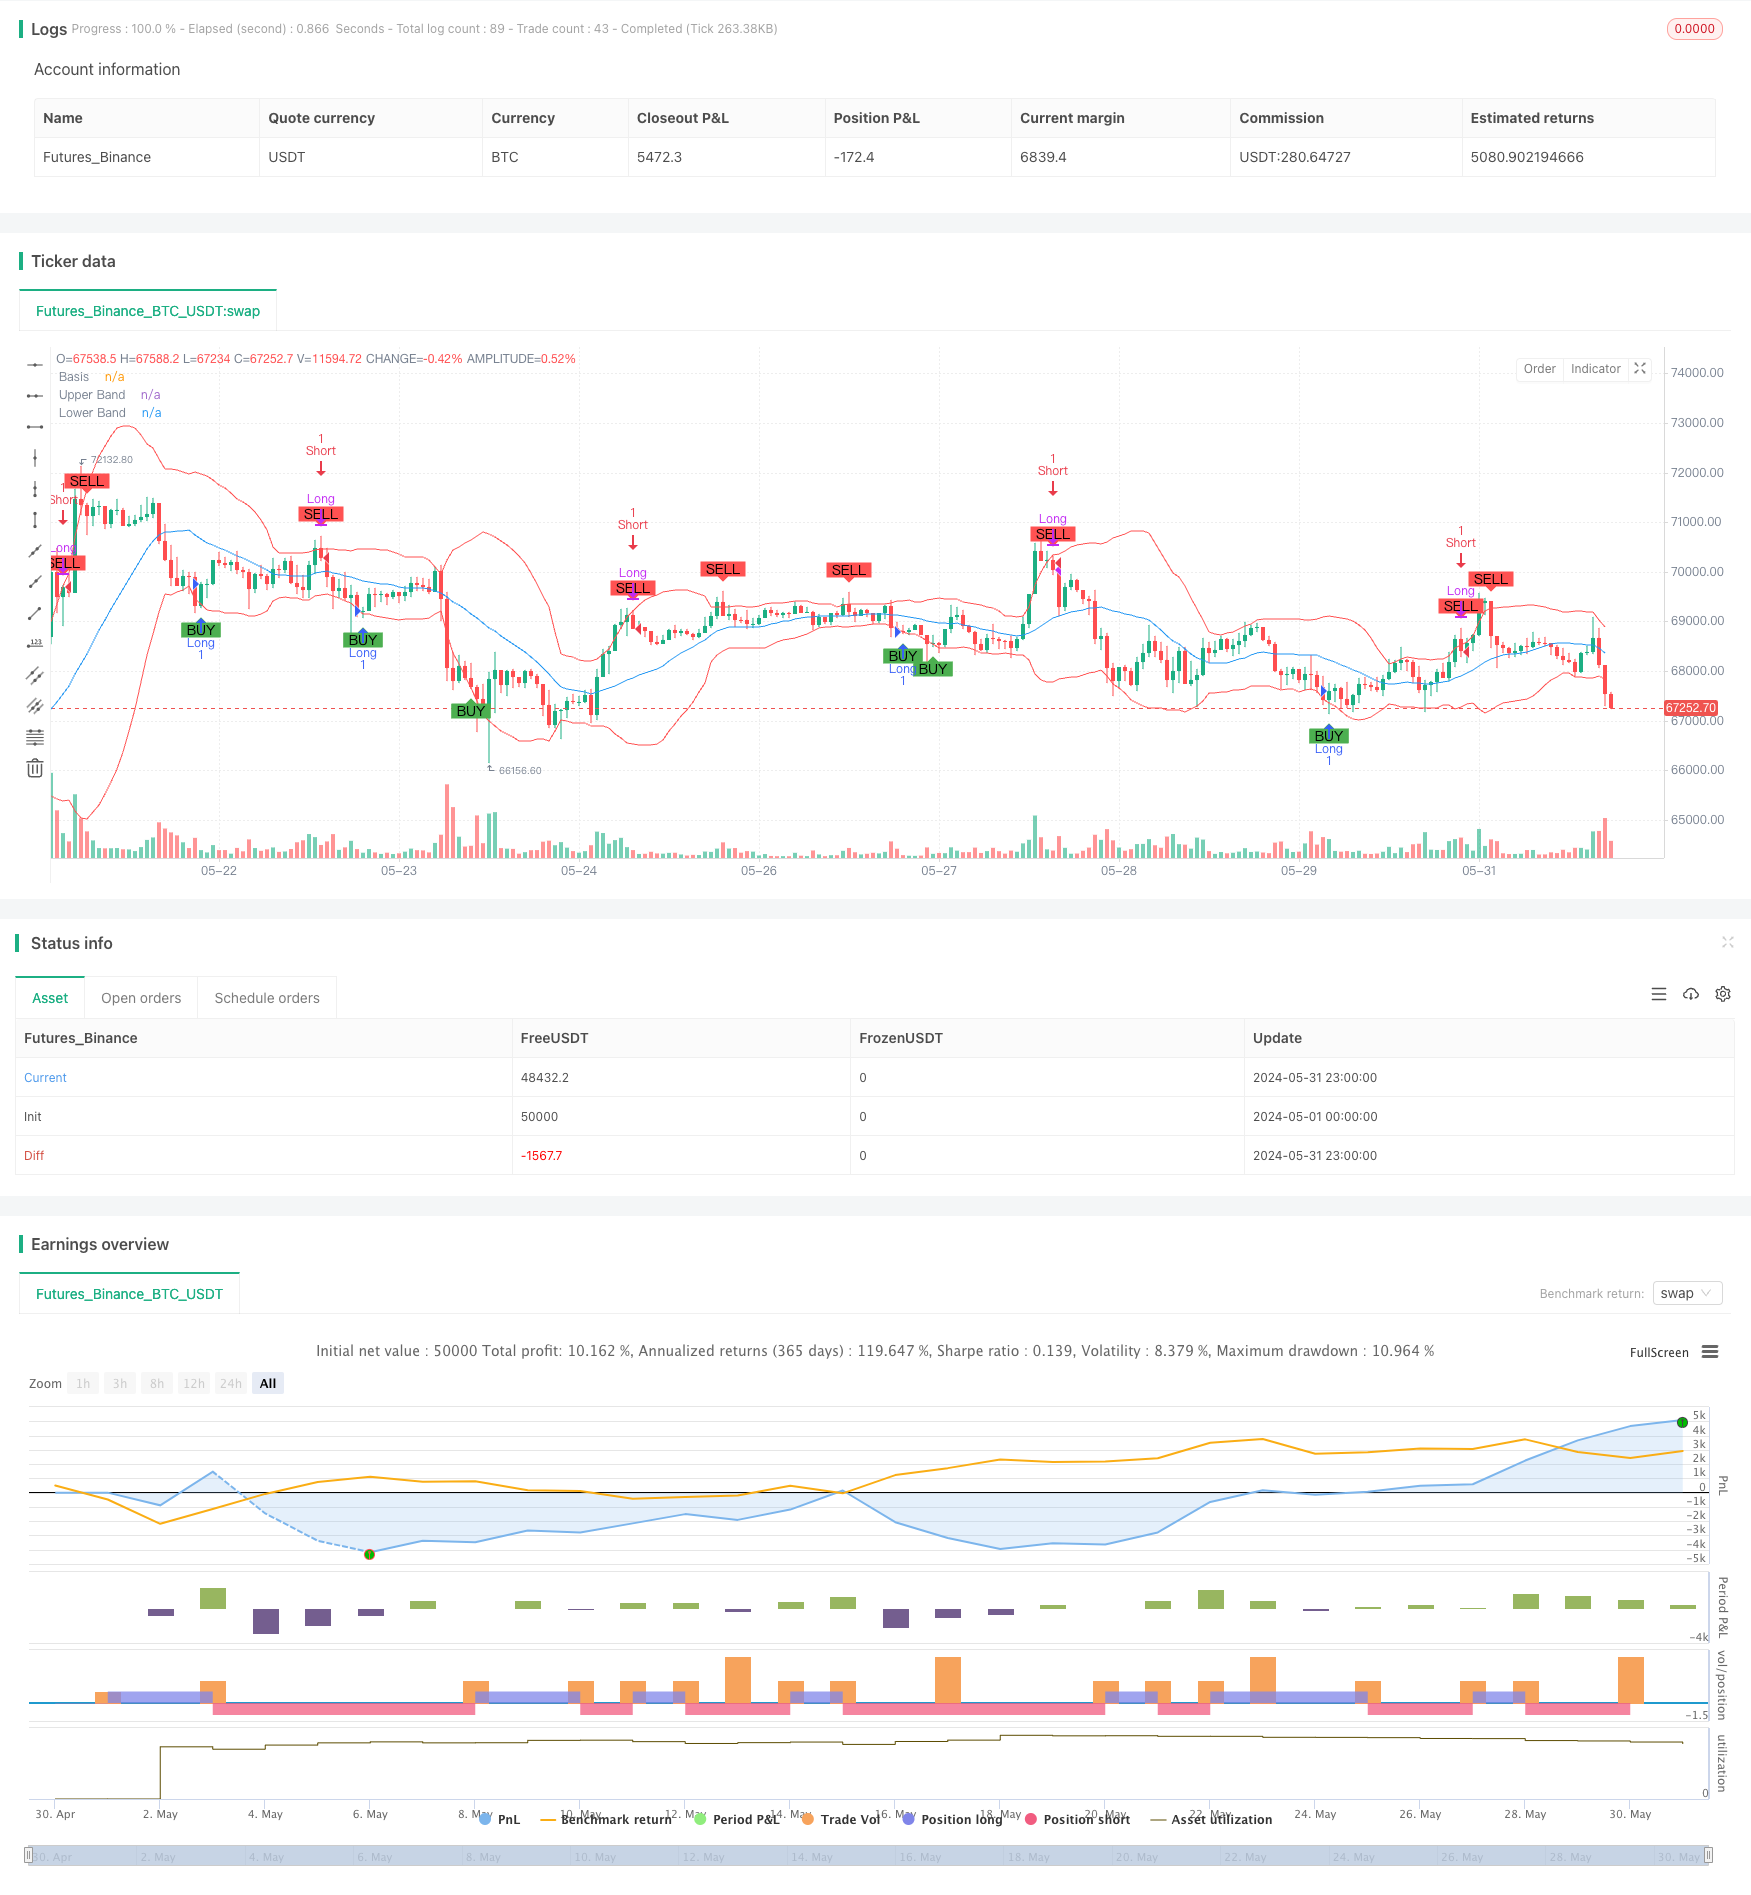
Overview
This strategy is a trading system based on Bollinger Bands and mean reversion principles, combined with a volume filter condition. The strategy capitalizes on price fluctuations between the upper and lower Bollinger Bands, buying when the price touches the lower band and selling when it touches the upper band, aiming to capture opportunities for price reversion to the mean. By introducing a volume filter, the strategy further enhances the reliability of trading signals, avoiding misjudgments in low liquidity situations.
Strategy Principles
Bollinger Bands Setup:
- Uses a 20-day calculation period
- Middle band is the 20-day Simple Moving Average (SMA)
- Upper and lower bands are 2 standard deviations above and below the middle band
Trading Signals:
- Buy signal: Price crosses above the lower Bollinger Band
- Sell signal: Price crosses below the upper Bollinger Band
Volume Filter:
- Optional volume filter can be enabled
- Volume must exceed a set threshold (default 100,000) to trigger trading signals
Trade Execution:
- Enter long position on buy signal
- Close long position and enter short on sell signal
- Close short position on buy signal
- If volume filter is enabled, trades are executed only when volume conditions are met
Strategy Advantages
Mean Reversion Principle: Leverages the mean-reverting nature of financial market price fluctuations, increasing profit probability.
Dynamic Adaptability: Bollinger Bands automatically adjust upper and lower band positions based on market volatility, allowing the strategy to adapt to different market environments.
Risk Control: The setup of Bollinger Bands provides natural stop-loss and take-profit levels for trades.
Volume Confirmation: Introducing volume filtering enhances the reliability of trading signals, reducing risks from false breakouts.
Bi-directional Trading: The strategy supports both long and short positions, fully utilizing market opportunities in both directions.
Visualization: Plotting Bollinger Bands and trading signals on charts facilitates intuitive understanding and analysis of strategy performance.
Strategy Risks
Choppy Market Risk: In sideways, volatile markets, frequent touches of the Bollinger Bands’ upper and lower limits may lead to consecutive losses.
Trend Market Deficiency: In strong trending markets, the strategy might miss out on significant price movements or frequently close positions, limiting profits.
False Breakout Risk: Despite volume filtering, false breakouts leading to erroneous trades may still occur.
Parameter Sensitivity: The performance of the strategy is highly dependent on the settings for Bollinger Bands period, multiplier, and volume threshold. Improper settings may lead to overtrading or missed opportunities.
Slippage and Trading Costs: Frequent trading may incur high transaction costs, impacting overall returns.
Strategy Optimization Directions
Trend Filtering: Introduce additional trend indicators (such as moving averages or ADX) to adjust strategy behavior in strong trending markets.
Dynamic Parameter Optimization: Automatically adjust Bollinger Bands parameters and volume thresholds based on market volatility to improve strategy adaptability.
Stop-Loss Optimization: Implement trailing stops or ATR-based dynamic stop-losses for better risk control.
Signal Confirmation: Combine other technical indicators (like RSI or MACD) for secondary confirmation of trading signals to improve accuracy.
Position Management: Implement partial profit-taking and position scaling logic to optimize capital management and risk-reward ratio.
Time Filtering: Add trading time window restrictions to avoid periods of high volatility or low liquidity.
Backtesting and Optimization: Conduct more comprehensive historical backtests and use methods like genetic algorithms to optimize parameter combinations.
Conclusion
The Bollinger Bands Mean Reversion Trading Strategy with Volume Filter is a quantitative trading system that combines technical analysis and statistical principles. By leveraging price fluctuations within Bollinger Bands and volume confirmation, this strategy aims to capture short-term market reversal opportunities. While the strategy performs well in range-bound markets, there is room for improvement in handling strong trends and managing risks. By introducing additional filtering conditions, dynamic parameter adjustments, and more sophisticated capital management strategies, its stability and profitability across different market environments can be further enhanced. Investors using this strategy should fully understand its strengths and limitations, and make appropriate parameter adjustments and risk controls based on personal risk preferences and market judgments.
/*backtest
start: 2024-05-01 00:00:00
end: 2024-05-31 23:59:59
period: 1h
basePeriod: 15m
exchanges: [{"eid":"Futures_Binance","currency":"BTC_USDT"}]
*/

//@version=5
strategy("Mean Regression Strategy", overlay=true)

// Bollinger Bands
length = input(20, title="Bollinger Bands Length")
src = input(close, title="Source")
mult = input(2.0, title="Bollinger Bands Multiplier")

basis = ta.sma(src, length)
dev = mult * ta.stdev(src, length)
upper = basis + dev
lower = basis - dev

// Plotting Bollinger Bands
plot(basis, title="Basis", color=color.blue)
plot(upper, title="Upper Band", color=color.red)
plot(lower, title="Lower Band", color=color.red)

// Trading logic
longCondition = ta.crossover(src, lower)
shortCondition = ta.crossunder(src, upper)

// Plotting signals
plotshape(series=longCondition, title="Buy Signal", location=location.belowbar, color=color.green, style=shape.labelup, text="BUY")
plotshape(series=shortCondition, title="Sell Signal", location=location.abovebar, color=color.red, style=shape.labeldown, text="SELL")

// Strategy execution
strategy.entry("Long", strategy.long, when=longCondition)
strategy.close("Long", when=shortCondition)
strategy.entry("Short", strategy.short, when=shortCondition)
strategy.close("Short", when=longCondition)

// Volume filter (optional)
useVolumeFilter = input(true, title="Use Volume Filter")
volumeThreshold = input(100000, title="Volume Threshold")

volumeCondition = na(volume) ? na : volume > volumeThreshold

if useVolumeFilter
    longCondition := longCondition and volumeCondition
    shortCondition := shortCondition and volumeCondition

// Final execution with volume filter
if useVolumeFilter
    strategy.entry("Long", strategy.long, when=longCondition)
    strategy.close("Long", when=shortCondition)
    strategy.entry("Short", strategy.short, when=shortCondition)
    strategy.close("Short", when=longCondition)