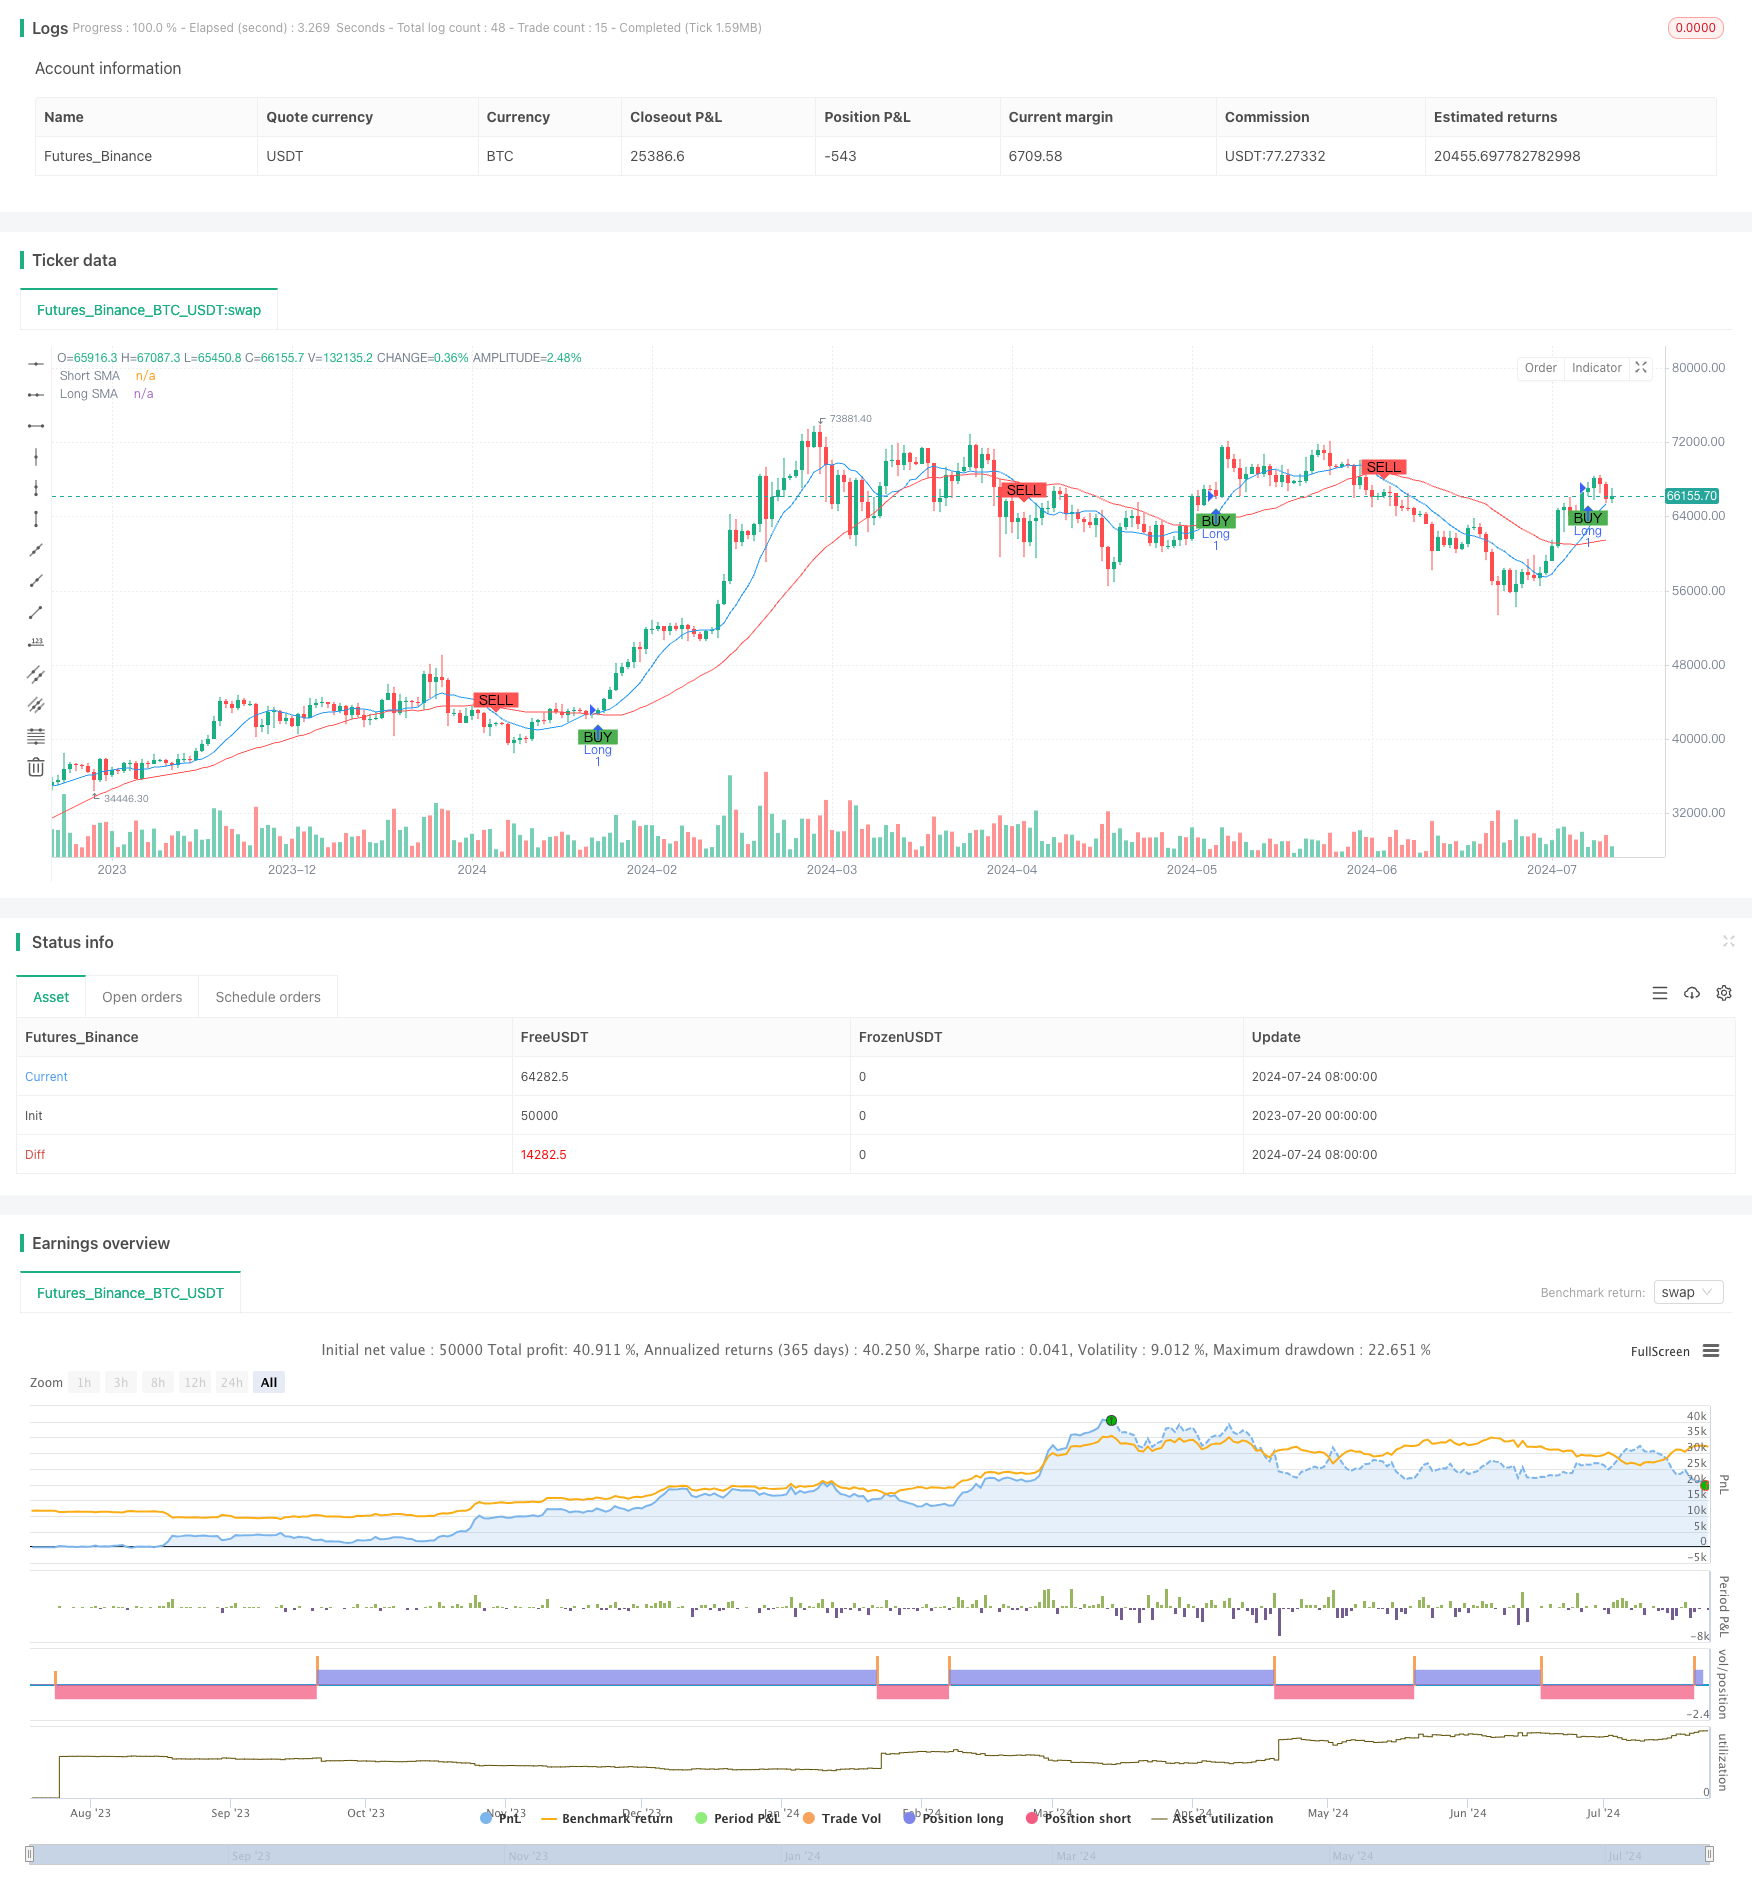
Overview
The Confirmed SMA Crossover Momentum Strategy is a quantitative trading approach that combines Simple Moving Average (SMA) crossovers with a confirmation mechanism. This strategy utilizes the crossing of short-term and long-term SMAs to identify potential trend changes, with an additional period of confirmation to enhance signal reliability. The strategy also incorporates stop-loss and take-profit mechanisms to manage risk and secure profits. This approach aims to capture market trend reversals while reducing the impact of false signals.
Strategy Principles
The core principles of this strategy are based on the following key elements:
Moving Average Crossovers: The strategy employs two SMAs - a short-term (10-period) and a long-term (30-period). A buy signal is generated when the short-term SMA crosses above the long-term SMA, while a sell signal occurs when the short-term SMA crosses below the long-term SMA.
Confirmation Mechanism: To reduce false signals, the strategy requires the crossover signal to be confirmed in the following period. Specifically, the buy condition not only requires the short-term SMA to cross above the long-term SMA in the previous period but also demands that the short-term SMA remains above the long-term SMA in the current period. The sell signal follows the same logic.
Risk Management: The strategy incorporates built-in stop-loss and take-profit mechanisms. The stop-loss is set at 1% to limit potential losses, while the take-profit is set at 10% to secure substantial profits.
Visualization: The strategy plots both short-term and long-term SMAs on the chart, along with buy and sell signal markers, allowing traders to visually observe market conditions and strategy signals.
Strategy Advantages
Trend Following: By using SMA crossovers, the strategy effectively identifies and follows market trends, suitable for medium to long-term trading.
Signal Confirmation: The additional period of confirmation helps reduce false signals, improving the reliability of trades.
Risk Management: Built-in stop-loss and take-profit mechanisms help control risk and protect profits, which is crucial for long-term trading stability.
Flexibility: Traders can adjust SMA periods, stop-loss, and take-profit levels according to their needs, making the strategy adaptable to different market environments and personal risk preferences.
Visualization: The strategy provides clear chart indications, including SMA lines and buy/sell signal markers, helping traders quickly understand market conditions and strategy judgments.
Strategy Risks
Lag: As lagging indicators, SMAs may not react quickly enough in rapidly changing markets, leading to missed trading opportunities or delayed signals.
Oscillating Markets: In sideways or oscillating markets, the SMA crossover strategy may produce frequent false signals, resulting in overtrading and unnecessary losses.
Fixed Stop-Loss: The 1% fixed stop-loss may be too tight in some high-volatility markets, causing frequent triggering.
Lack of Market Environment Filtering: The strategy does not consider overall market conditions and may generate signals in market environments unsuitable for trend following.
Single Technical Indicator: Relying solely on SMAs may ignore other important market information, such as volume and volatility.
Strategy Optimization Directions
Dynamic Stop-Loss: Consider using the Average True Range (ATR) to set dynamic stop-losses that automatically adjust based on market volatility.
Market Environment Filtering: Introduce indicators like the Average Directional Index (ADX) to assess trend strength and execute trades only in strong trend markets.
Multiple Timeframe Analysis: Incorporate longer-term moving averages or trend indicators to ensure trade direction aligns with larger market trends.
Volume Confirmation: In addition to price confirmation, consider adding volume confirmation to increase signal reliability.
Machine Learning Optimization: Use machine learning algorithms to dynamically adjust SMA parameters to adapt to different market cycles.
Backtesting and Optimization: Conduct comprehensive backtests on various parameter combinations to find the best settings for different market conditions.
Conclusion
The Confirmed SMA Crossover Momentum Strategy is a quantitative trading method that combines classical technical analysis with risk management. By using SMA crossovers and a confirmation mechanism, this strategy aims to capture significant market trend reversals while reducing false signals through an additional confirmation step. The built-in stop-loss and take-profit mechanisms further enhance the strategy’s risk management capabilities.
However, like all trading strategies, it is not without flaws. Performance in oscillating markets may be suboptimal, and over-reliance on a single technical indicator may lead to overlooking other important market information. By introducing optimization measures such as dynamic stop-losses, market environment filtering, and multiple timeframe analysis, the strategy’s robustness and adaptability can be significantly improved.
Ultimately, successful application of this strategy requires traders to deeply understand its principles, continuously backtest and optimize, and make appropriate parameter adjustments based on personal risk tolerance and market insights. With correct application and ongoing improvements, the Confirmed SMA Crossover Momentum Strategy has the potential to become a powerful tool in a trader’s arsenal.
/*backtest
start: 2023-07-20 00:00:00
end: 2024-07-25 00:00:00
period: 1d
basePeriod: 1h
exchanges: [{"eid":"Futures_Binance","currency":"BTC_USDT"}]
*/

//@version=5
strategy("SMA Crossover Strategy with Confirmation", overlay=true)

// Input settings
shortSmaLength = input.int(10, title="Short SMA Length")
longSmaLength = input.int(30, title="Long SMA Length")
stopLossPercent = input.float(1.0, title="Stop Loss (%)", step=0.1) / 100
takeProfitPercent = input.float(10.0, title="Take Profit (%)", step=0.1) / 100

// Calculations
shortSma = ta.sma(close, shortSmaLength)
longSma = ta.sma(close, longSmaLength)

// Buy signal: Short SMA crosses above Long SMA and holds for one bar
buyCondition = ta.crossover(shortSma[1], longSma[1]) and shortSma > longSma

// Sell signal: Long SMA crosses above Short SMA and holds for one bar
sellCondition = ta.crossunder(shortSma[1], longSma[1]) and longSma > shortSma

// Execute strategy orders
if (buyCondition)
    strategy.entry("Long", strategy.long, stop=close * (1 - stopLossPercent), limit=close * (1 + takeProfitPercent))

if (sellCondition)
    strategy.entry("Short", strategy.short, stop=close * (1 - stopLossPercent), limit=close * (1 + takeProfitPercent))

// Plotting
plot(shortSma, title="Short SMA", color=color.blue)
plot(longSma, title="Long SMA", color=color.red)

// Signal markers on price chart
plotshape(series=buyCondition, title="Buy Signal", location=location.belowbar, color=color.green, style=shape.labelup, text="BUY")
plotshape(series=sellCondition, title="Sell Signal", location=location.abovebar, color=color.red, style=shape.labeldown, text="SELL")