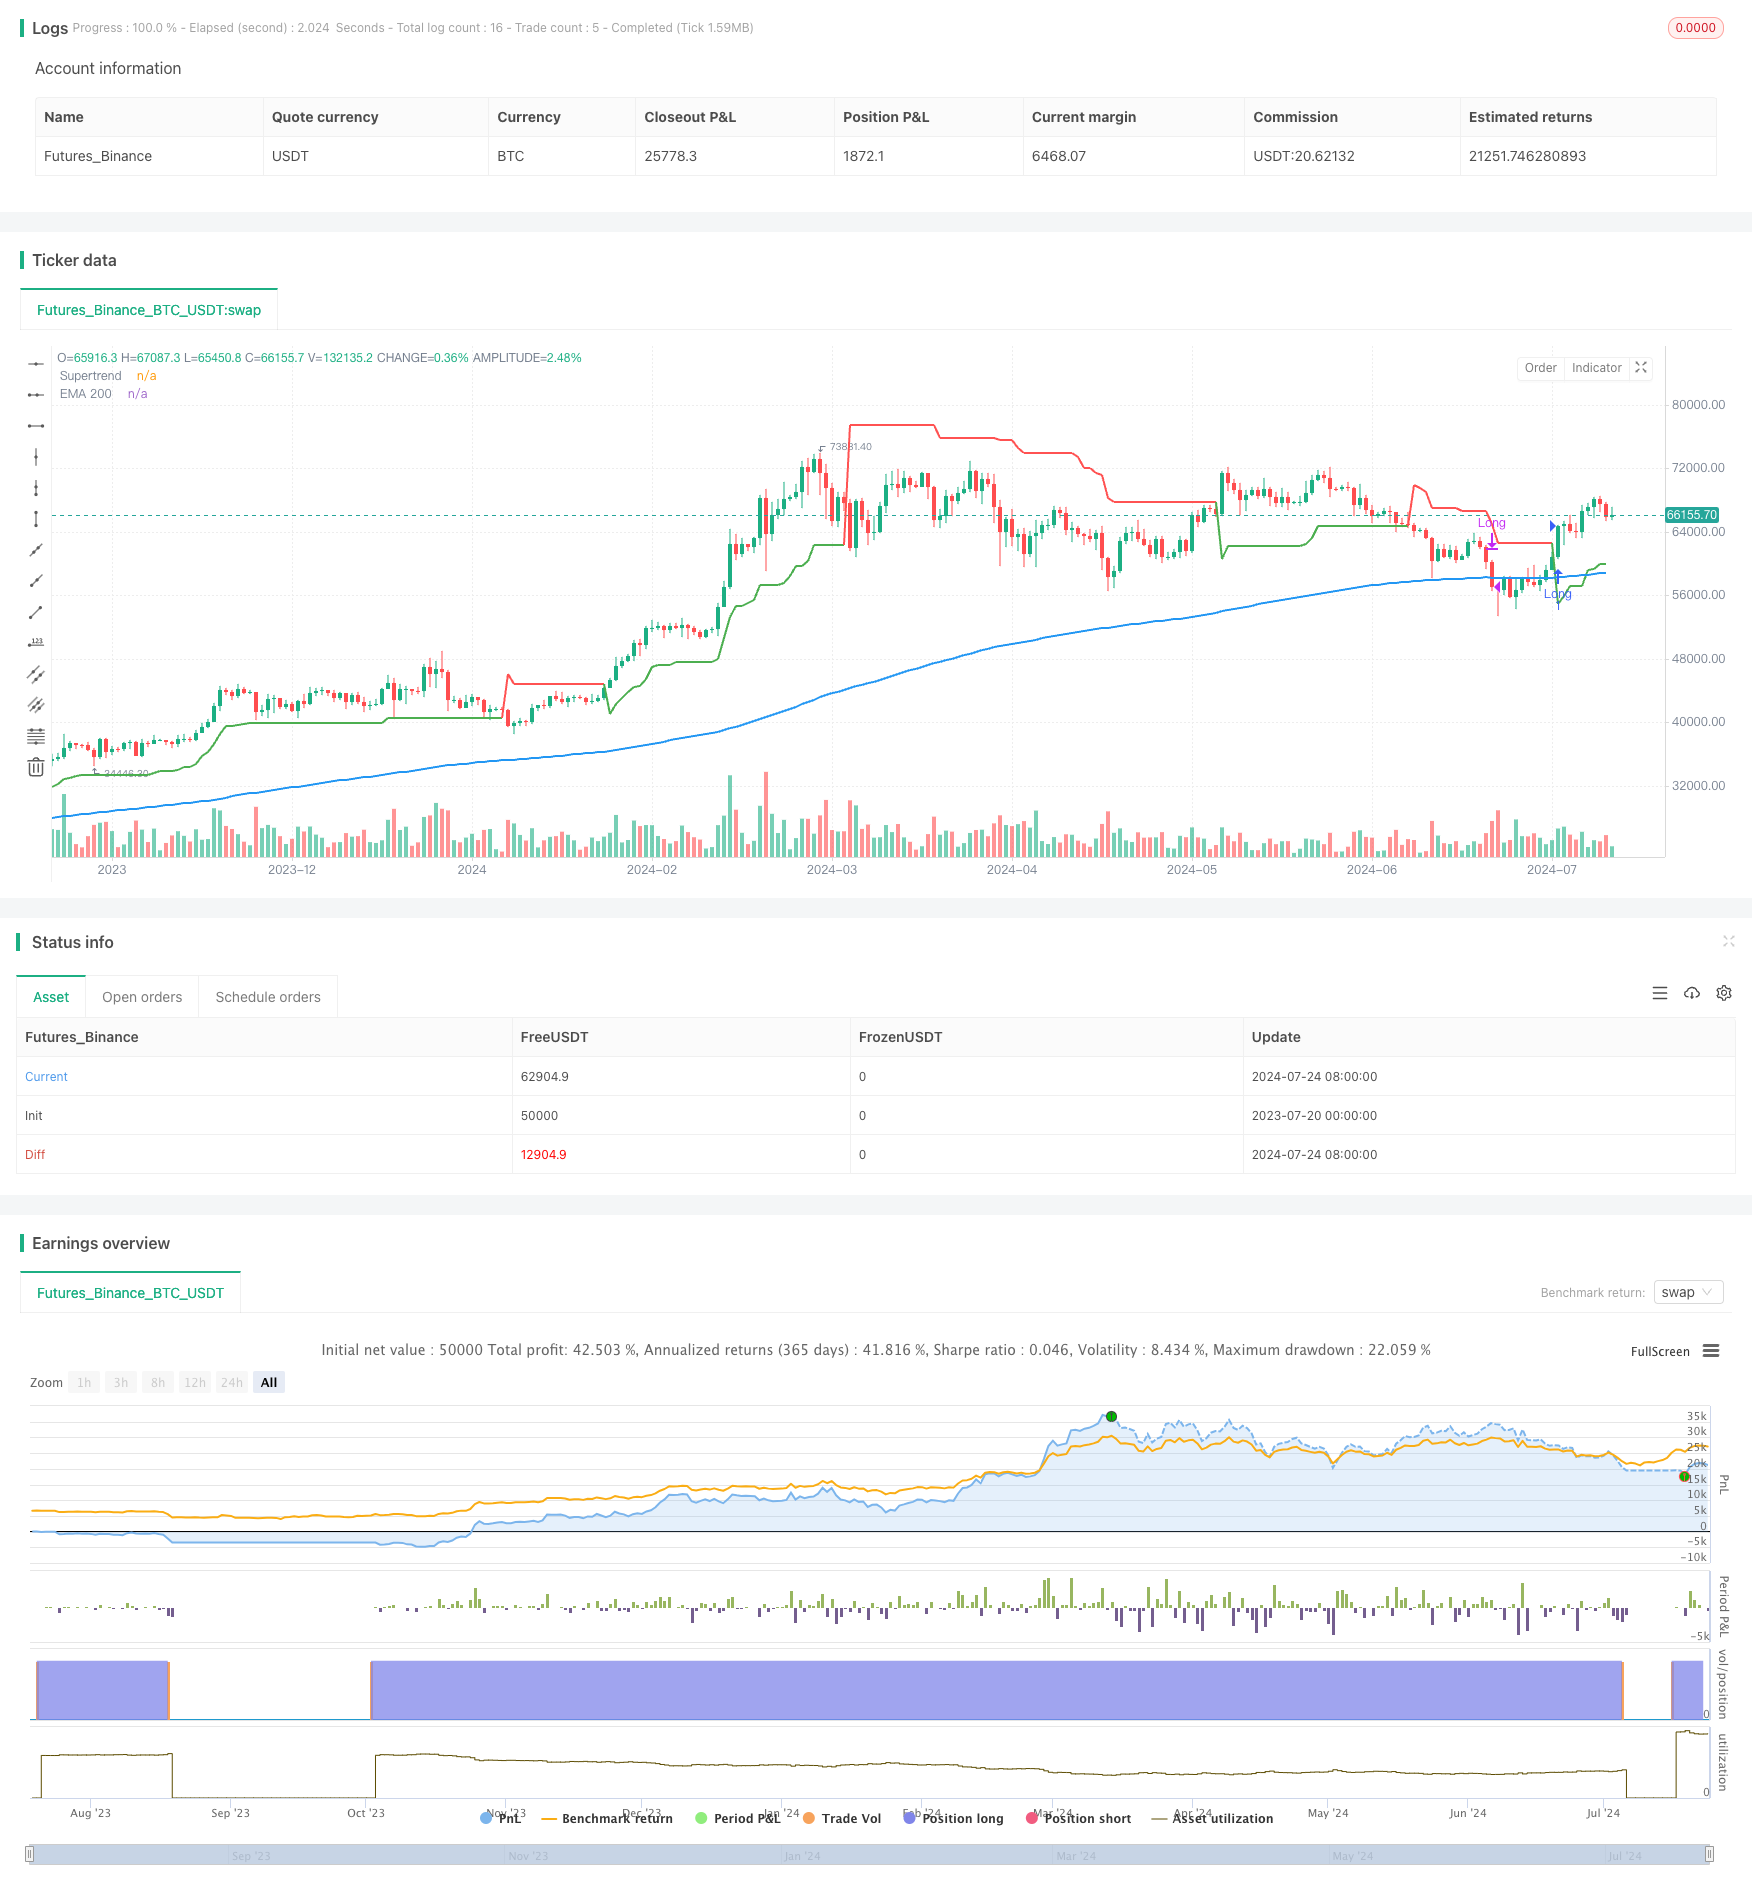
Overview
This strategy is a multi-indicator trend following system that primarily utilizes the SuperTrend indicator and the 200-period Exponential Moving Average (EMA) to identify market trends and execute trades. The strategy also incorporates Stop Loss (SL) and Take Profit (TP) mechanisms to manage risk and lock in profits. It is a long-only strategy designed to capture uptrends and protect capital during downtrends.
Strategy Principles
SuperTrend Indicator: Calculated using a 10-period Average True Range (ATR) and a factor of 3.0. This indicator is used to determine the overall trend direction of the market.
200-period EMA: Serves as a long-term trend indicator to confirm the overall market direction.
Entry Condition: The strategy enters a long position when the SuperTrend indicator turns bullish (green) and the price is above the 200 EMA.
Exit Condition: The strategy exits the position when the SuperTrend indicator turns bearish (red) and the price falls below the 200 EMA.
Risk Management: The strategy employs percentage-based stop loss and take profit levels. The stop loss is set at 1% below the entry price, while the take profit is set at 5% above the entry price.
Strategy Advantages
Multiple Confirmations: By combining SuperTrend and 200 EMA, the strategy can more accurately identify strong uptrends, reducing losses from false breakouts.
Trend Following: The strategy is designed to capture medium to long-term trends, offering the potential for significant gains.
Risk Management: Built-in stop loss and take profit mechanisms help control risk for each trade and protect profits when the market reverses.
Long-Only Strategy: By trading only in uptrends, the strategy avoids the additional risks and costs associated with short selling.
Simplicity: The strategy logic is clear and easy to understand and implement, making it suitable for traders of all levels.
Strategy Risks
Lag: Both EMA and SuperTrend are lagging indicators, which may result in missed opportunities or some losses during the initial stages of trend reversals.
Choppy Markets: In sideways or choppy markets, the strategy may result in frequent entries and exits, leading to excessive trading costs.
Fixed Stop Loss: The 1% fixed stop loss may not be flexible enough in some more volatile markets, potentially leading to premature triggering.
Long-Only Limitation: In bear markets or prolonged downtrends, the strategy may remain on the sidelines for extended periods, missing potential short opportunities.
Parameter Sensitivity: The strategy’s performance may be sensitive to the parameter settings of SuperTrend and EMA, requiring careful optimization.
Strategy Optimization Directions
Dynamic Stop Loss: Consider implementing a trailing stop loss or an ATR-based dynamic stop loss to better adapt to market volatility.
Entry Optimization: Add additional filter conditions, such as volume confirmation or other momentum indicators, to reduce false breakouts.
Parameter Optimization: Conduct backtests and optimize the ATR period and factor for SuperTrend, as well as the EMA period, to find the best combination.
Multi-Timeframe Analysis: Consider applying the strategy across multiple timeframes to gain a more comprehensive market perspective.
Volatility Adjustment: Dynamically adjust stop loss and take profit levels based on market volatility to adapt to different market conditions.
Consider Short Selling: Add short-selling logic to fully utilize downtrends under appropriate market conditions.
Money Management: Implement a more sophisticated position sizing system that dynamically adjusts trade size based on market conditions and account size.
Conclusion
This multi-indicator trend following strategy, combining SuperTrend, EMA 200, and risk management, provides traders with a relatively robust trading framework. By leveraging the strengths of multiple indicators, the strategy aims to capture strong uptrends while protecting capital during market reversals. The built-in risk management mechanisms help control risk for each trade, making it suitable for traders with different risk appetites.
However, traders should be aware of the strategy’s limitations, such as potentially poor performance in choppy markets and the limitations of a long-only approach in declining markets. Through continuous optimization and adjustments, such as implementing dynamic stop losses, multi-timeframe analysis, and considering short positions, the strategy’s robustness and adaptability can be further improved.
Overall, this strategy provides a good starting point for technical analysis and trend following, but successful application still requires ongoing monitoring, optimization, and market insight from the trader. Before using it in live trading, it is recommended to conduct thorough backtesting and paper trading to ensure the strategy aligns with personal trading style and risk tolerance.
/*backtest
start: 2023-07-20 00:00:00
end: 2024-07-25 00:00:00
period: 1d
basePeriod: 1h
exchanges: [{"eid":"Futures_Binance","currency":"BTC_USDT"}]
*/

//@version=5
strategy("Supertrend + EMA 200 Long Only Strategy with SL and TP", overlay=true)

// Inputs for Supertrend
atr_length = input.int(10, title="ATR Length")
factor = input.float(3.0, title="ATR Factor")

// Input for EMA
ema_length = input.int(200, title="EMA Length")

// Inputs for Stop Loss and Take Profit
stop_loss_perc = input.float(1.0, title="Stop Loss Percentage", step=0.1) / 100
take_profit_perc = input.float(5.0, title="Take Profit Percentage", step=0.1) / 100

// Calculate EMA 200
ema_200 = ta.ema(close, ema_length)

// Calculate Supertrend
atr = ta.atr(atr_length)
upperband = hl2 + (factor * atr)
lowerband = hl2 - (factor * atr)

var float supertrend = na
var int direction = na

// Initialize supertrend on first bar
if (na(supertrend[1]))
    supertrend := lowerband
    direction := 1
else
    // Update supertrend value
    if (direction == 1)
        supertrend := close < supertrend[1] ? upperband : math.max(supertrend[1], lowerband)
    else
        supertrend := close > supertrend[1] ? lowerband : math.min(supertrend[1], upperband)

    // Update direction
    direction := close > supertrend ? 1 : -1

// Buy condition: Supertrend is green and price is above EMA 200
longCondition = direction == 1 and close > ema_200

// Sell condition: Supertrend is red and price is below EMA 200
exitCondition = direction == -1 and close < ema_200

// Plot EMA 200
plot(ema_200, title="EMA 200", color=color.blue, linewidth=2)

// Plot Supertrend
plot(supertrend, title="Supertrend", color=direction == 1 ? color.green : color.red, linewidth=2)

// Calculate stop loss and take profit levels
long_stop_loss = close * (1 - stop_loss_perc)
long_take_profit = close * (1 + take_profit_perc)

// Strategy Entry and Exit
if (longCondition and not na(supertrend))
    strategy.entry("Long", strategy.long, stop=long_stop_loss, limit=long_take_profit)

if (strategy.position_size > 0 and exitCondition)
    strategy.close("Long")