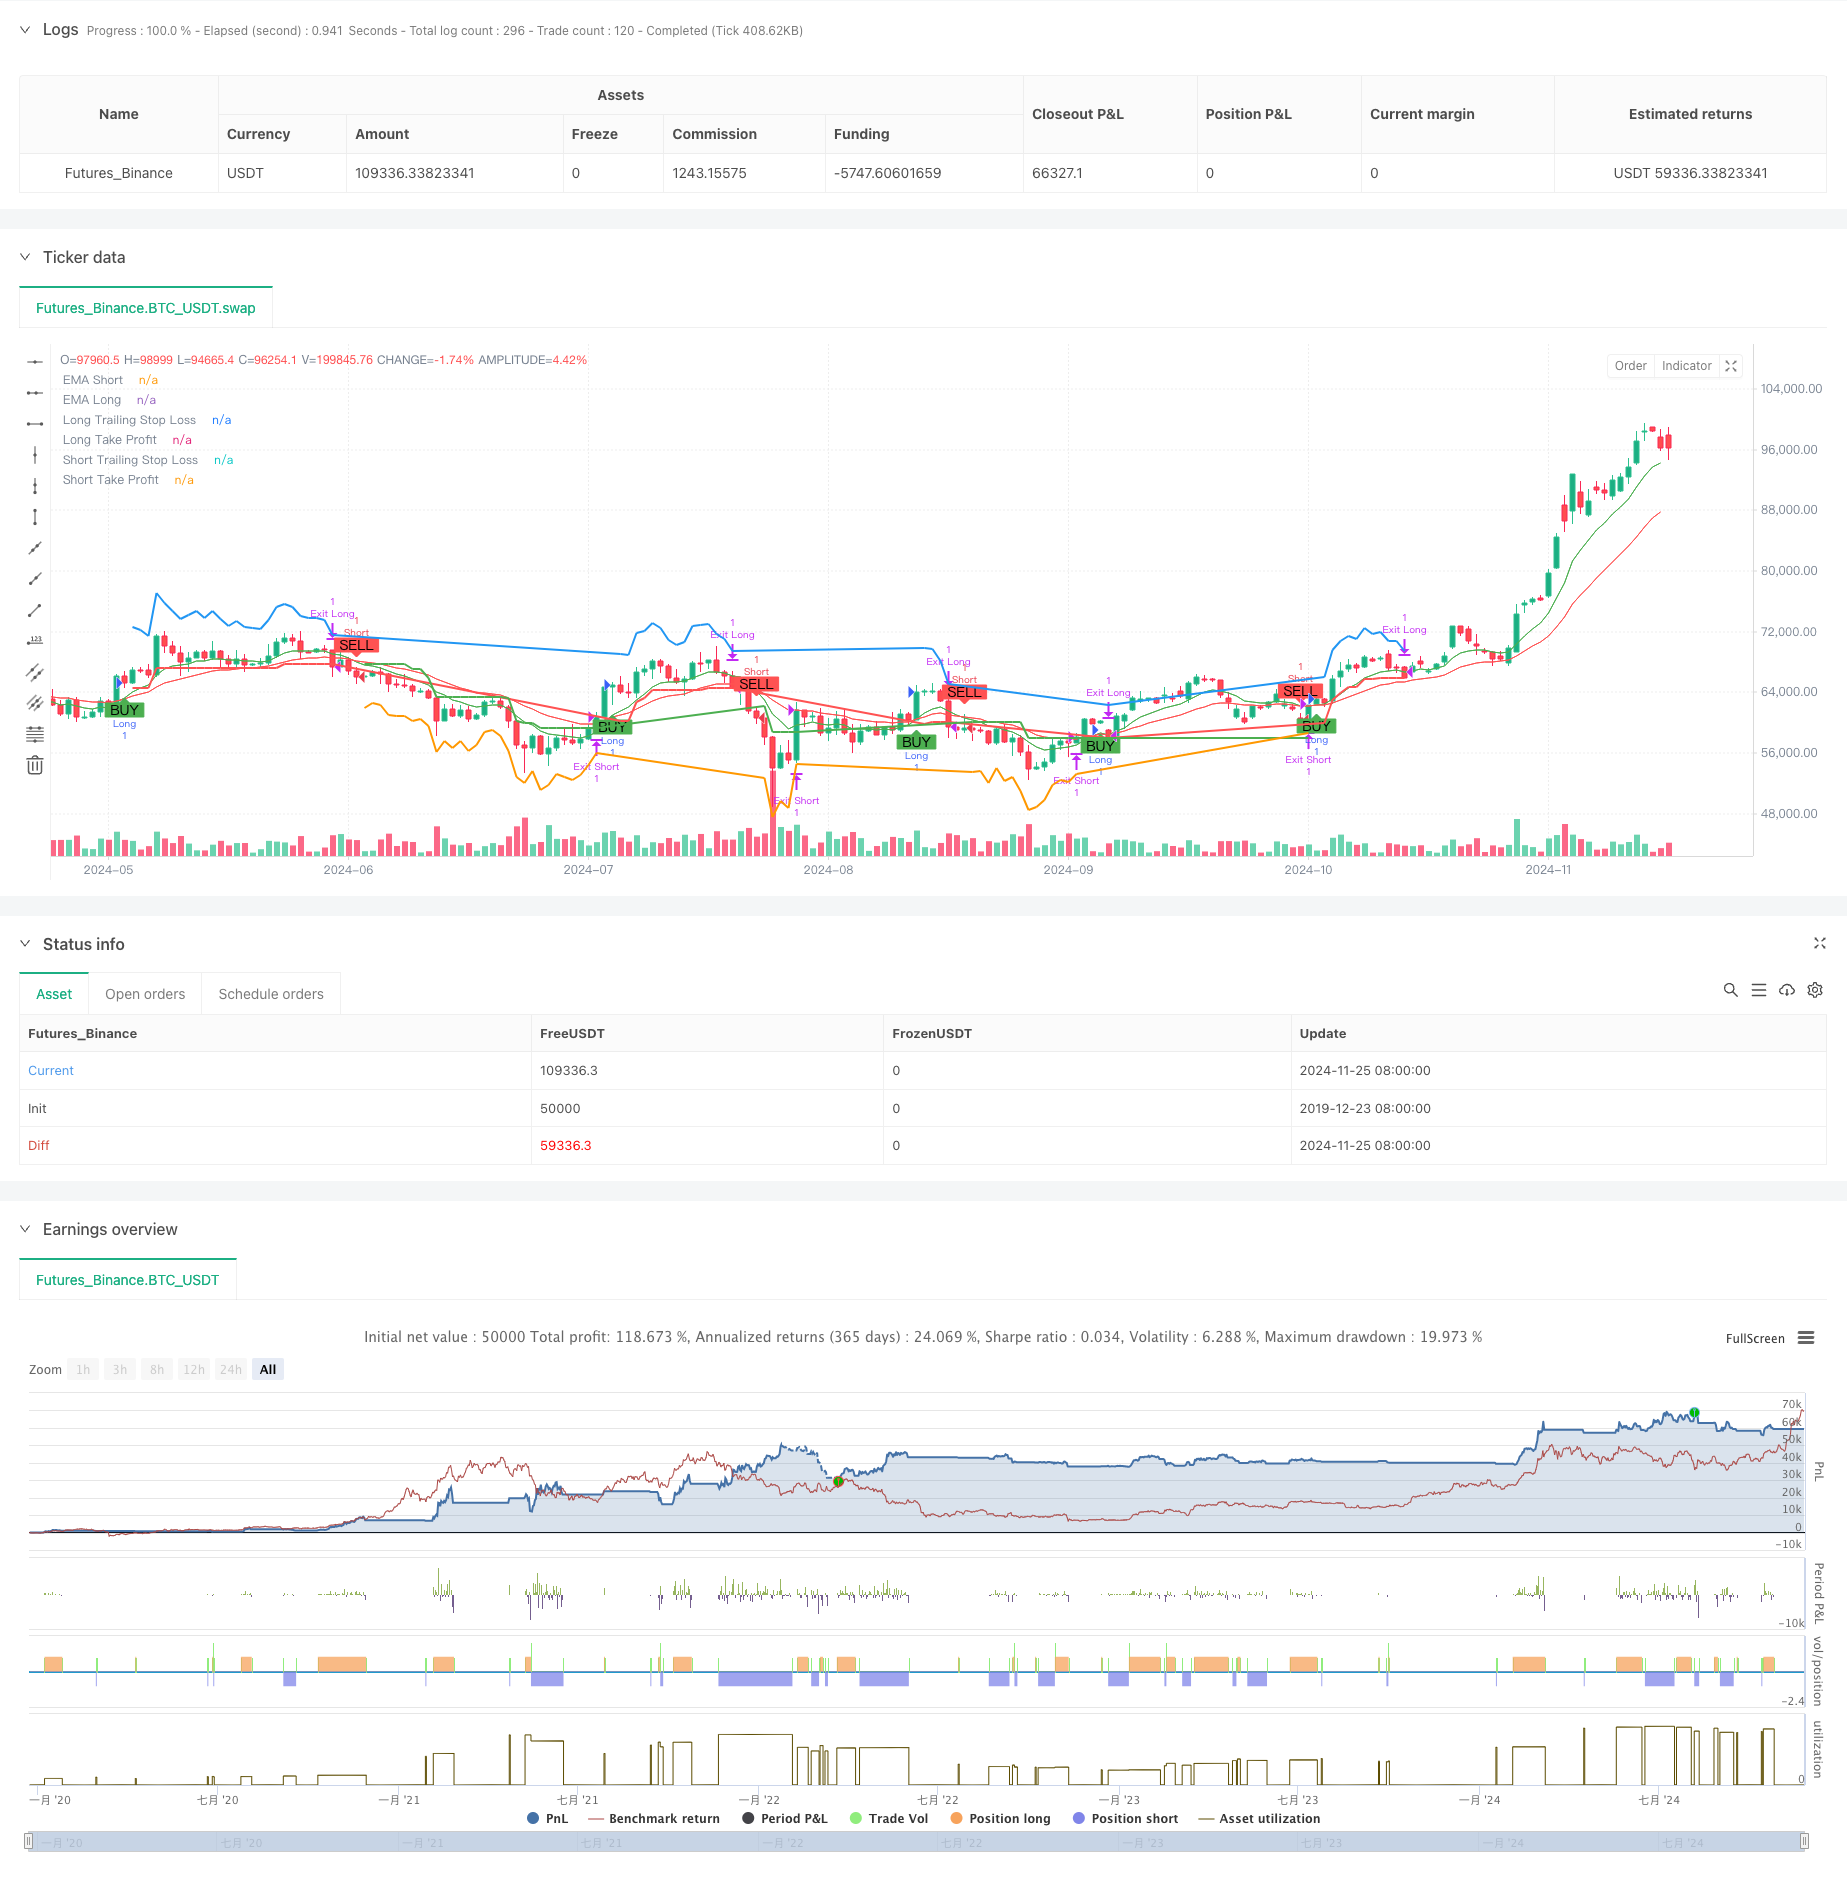
Overview
This is a trend following strategy that combines multi-timeframe analysis and volatility management. The strategy core uses dual EMA crossover for trend direction, RSI indicator for overbought/oversold filtering, incorporates higher timeframe EMA for overall trend confirmation, and utilizes ATR indicator for dynamic stop-loss and profit target management. Through the coordinated use of multiple technical indicators, the strategy ensures both signal reliability and effective risk control.
Strategy Principles
The core trading logic consists of the following key components: 1. Trend Identification: Uses crossovers of short-period and long-period EMAs to identify trend changes, generating long signals when short EMA crosses above long EMA and short signals when it crosses below. 2. Trend Confirmation: Incorporates higher timeframe EMA as a trend filter, allowing long positions only when price is above the higher timeframe EMA and short positions when below. 3. Volatility Filtering: Uses RSI indicator for overbought/oversold judgment to prevent entry during excessive momentum. 4. Position Management: Sets dynamic stop-loss and profit targets based on ATR, automatically adjusting stop-loss positions as price moves to protect existing profits. 5. Multi-dimensional Protection: Constructs a complete trading decision system through the comprehensive use of multiple technical indicators.
Strategy Advantages
- High Signal Reliability: Significantly improves trading signal reliability through the combination of multiple technical indicators.
- Comprehensive Risk Control: Adopts ATR-based dynamic stop-loss strategy that adaptively adjusts stop positions based on market volatility.
- Accurate Trend Capture: Improves major trend judgment accuracy through multi-timeframe analysis.
- Flexible Profit Targets: Take-profit levels also dynamically adjust based on ATR, ensuring profits while avoiding premature exits.
- Strong Adaptability: Strategy parameters are highly adjustable to adapt to different market environments.
Strategy Risks
- Ranging Market Risk: May result in frequent trading losses during sideways consolidation periods.
- Slippage Risk: Actual execution prices may significantly deviate from theoretical prices during highly volatile periods.
- False Breakout Risk: May exit on stop-loss after short-term breakouts followed by reversals.
- Parameter Sensitivity: Different parameter combinations significantly impact strategy performance, requiring thorough testing.
Strategy Optimization Directions
- Market Environment Recognition: Can add trend strength indicators to automatically reduce position size or pause trading in ranging markets.
- Entry Timing Optimization: Can incorporate volume indicators to improve entry signal reliability.
- Dynamic Parameter Adjustment: Can automatically adjust EMA periods and ATR multipliers based on market volatility.
- Scaled Position Building: Can design scaled entry and exit mechanisms to reduce single price point risk.
- Position Management Optimization: Can dynamically adjust position size based on account risk and market volatility.
Summary
This is a well-designed trend following strategy that achieves favorable risk-reward characteristics through multi-timeframe analysis and volatility management. The core advantage lies in the organic combination of multiple technical indicators, ensuring both trading reliability and effective risk control. While some potential risks exist, the strategy’s overall performance still has room for improvement through continuous optimization and refinement. It’s crucial to focus on parameter optimization and backtesting validation while strictly implementing risk control measures in live trading.
/*backtest
start: 2019-12-23 08:00:00
end: 2024-11-26 00:00:00
period: 1d
basePeriod: 1d
exchanges: [{"eid":"Futures_Binance","currency":"BTC_USDT"}]
*/

//@version=5
strategy("Trend Following with ATR and MTF Confirmation", overlay=true)

// Parameters
emaShortPeriod = input.int(9, title="Short EMA Period", minval=1)
emaLongPeriod = input.int(21, title="Long EMA Period", minval=1)
rsiPeriod = input.int(14, title="RSI Period", minval=1)
rsiOverbought = input.int(70, title="RSI Overbought", minval=50)
rsiOversold = input.int(30, title="RSI Oversold", minval=1)
atrPeriod = input.int(14, title="ATR Period", minval=1)
atrMultiplier = input.float(1.5, title="ATR Multiplier", minval=0.1)
takeProfitATRMultiplier = input.float(2.0, title="Take Profit ATR Multiplier", minval=0.1)

// Multi-timeframe settings
htfEMAEnabled = input.bool(true, title="Use Higher Timeframe EMA Confirmation?", inline="htf")
htfEMATimeframe = input.timeframe("D", title="Higher Timeframe", inline="htf")

// Select trade direction
tradeDirection = input.string("Both", title="Trade Direction", options=["Both", "Long", "Short"])

// Calculating indicators
emaShort = ta.ema(close, emaShortPeriod)
emaLong = ta.ema(close, emaLongPeriod)
rsiValue = ta.rsi(close, rsiPeriod)
atrValue = ta.atr(atrPeriod)

// Higher timeframe EMA confirmation
htfEMALong = request.security(syminfo.tickerid, htfEMATimeframe, ta.ema(close, emaLongPeriod))

// Trading conditions
longCondition = ta.crossover(emaShort, emaLong) and rsiValue < rsiOverbought and (not htfEMAEnabled or close > htfEMALong)
shortCondition = ta.crossunder(emaShort, emaLong) and rsiValue > rsiOversold and (not htfEMAEnabled or close < htfEMALong)

// Plotting EMAs
plot(emaShort, title="EMA Short", color=color.green)
plot(emaLong, title="EMA Long", color=color.red)

// Trailing Stop-Loss and Take-Profit levels
var float trailStopLoss = na
var float trailTakeProfit = na

// Exit conditions
var bool exitLongCondition = na
var bool exitShortCondition = na

if (strategy.position_size != 0)
    if (strategy.position_size > 0) // Long Position
        trailStopLoss := na(trailStopLoss) ? close - atrValue * atrMultiplier : math.max(trailStopLoss, close - atrValue * atrMultiplier)
        trailTakeProfit := close + atrValue * takeProfitATRMultiplier
        exitLongCondition := close <= trailStopLoss or close >= trailTakeProfit
        strategy.exit("Exit Long", "Long", stop=trailStopLoss, limit=trailTakeProfit, when=exitLongCondition)
    else // Short Position
        trailStopLoss := na(trailStopLoss) ? close + atrValue * atrMultiplier : math.min(trailStopLoss, close + atrValue * atrMultiplier)
        trailTakeProfit := close - atrValue * takeProfitATRMultiplier
        exitShortCondition := close >= trailStopLoss or close <= trailTakeProfit
        strategy.exit("Exit Short", "Short", stop=trailStopLoss, limit=trailTakeProfit, when=exitShortCondition)

// Strategy Entry
if (longCondition and (tradeDirection == "Both" or tradeDirection == "Long"))
    strategy.entry("Long", strategy.long)

if (shortCondition and (tradeDirection == "Both" or tradeDirection == "Short"))
    strategy.entry("Short", strategy.short)

// Plotting Buy/Sell signals
plotshape(series=longCondition, title="Buy Signal", location=location.belowbar, color=color.green, style=shape.labelup, text="BUY")
plotshape(series=shortCondition, title="Sell Signal", location=location.abovebar, color=color.red, style=shape.labeldown, text="SELL")

// Plotting Trailing Stop-Loss and Take-Profit levels
plot(strategy.position_size > 0 ? trailStopLoss : na, title="Long Trailing Stop Loss", color=color.red, linewidth=2, style=plot.style_line)
plot(strategy.position_size < 0 ? trailStopLoss : na, title="Short Trailing Stop Loss", color=color.green, linewidth=2, style=plot.style_line)
plot(strategy.position_size > 0 ? trailTakeProfit : na, title="Long Take Profit", color=color.blue, linewidth=2, style=plot.style_line)
plot(strategy.position_size < 0 ? trailTakeProfit : na, title="Short Take Profit", color=color.orange, linewidth=2, style=plot.style_line)

// Alerts
alertcondition(longCondition, title="Buy Alert", message="Buy Signal Triggered")
alertcondition(shortCondition, title="Sell Alert", message="Sell Signal Triggered")
alertcondition(exitLongCondition, title="Long Exit Alert", message="Long Position Closed")
alertcondition(exitShortCondition, title="Short Exit Alert", message="Short Position Closed")