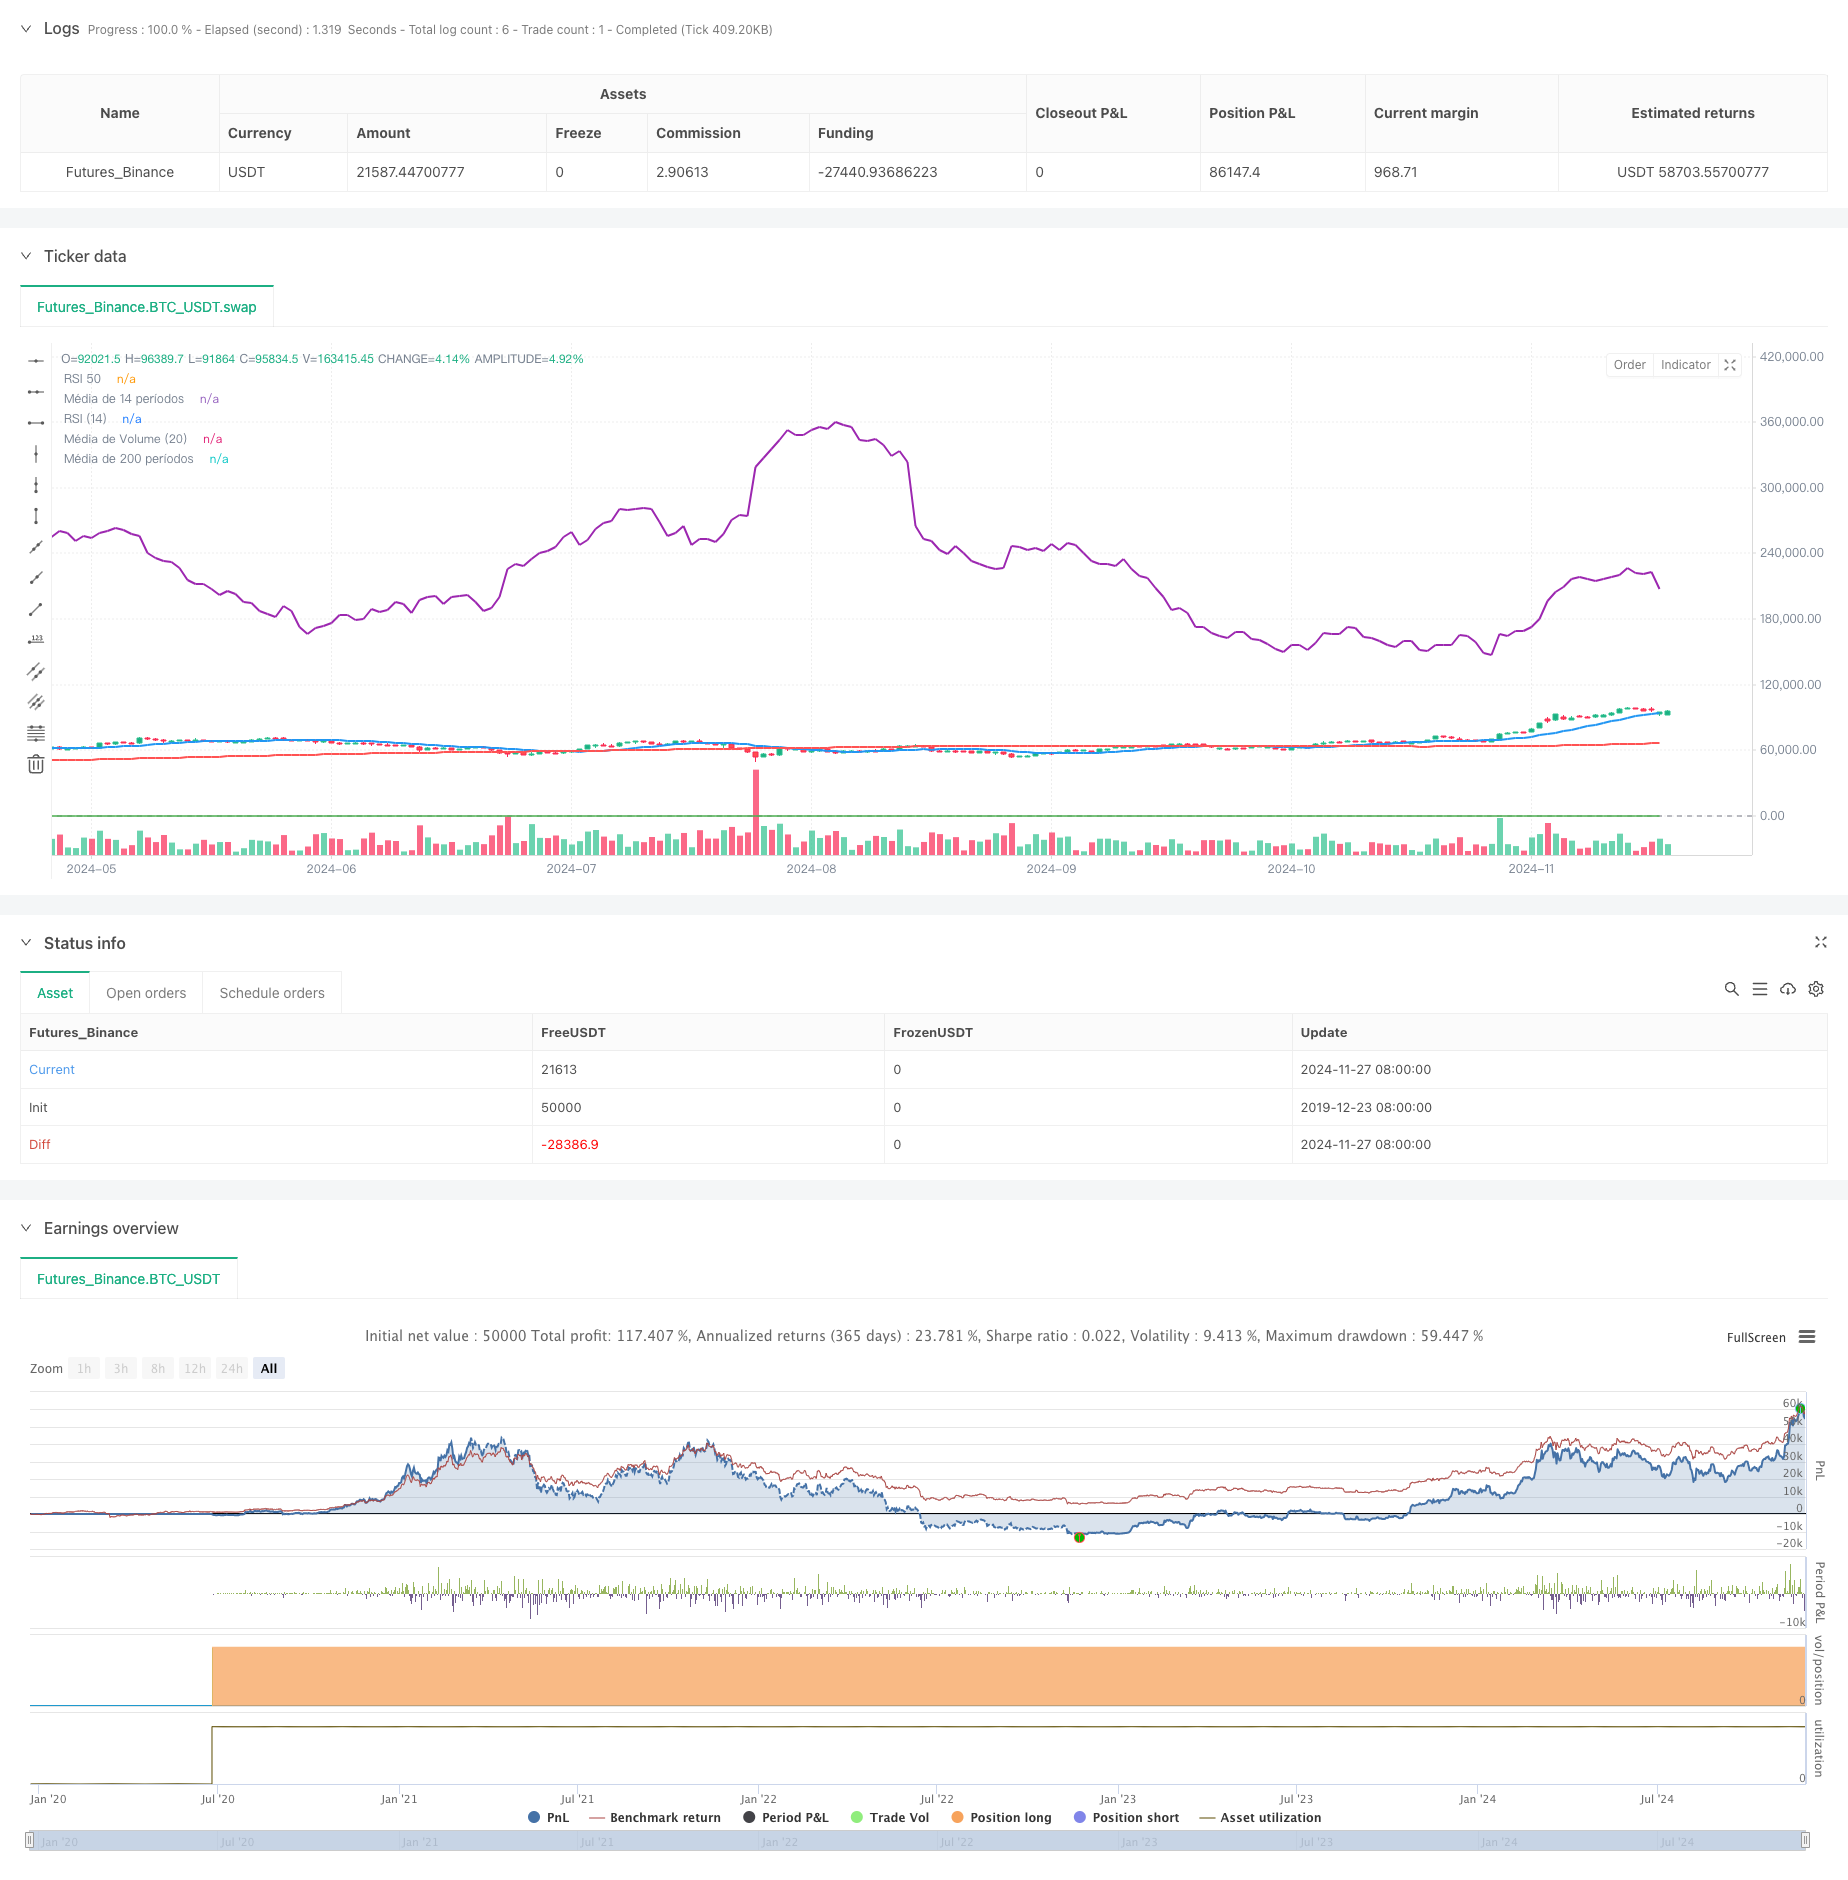
Overview
This strategy is a trend-following trading system that combines multiple technical indicators including Relative Strength Index (RSI), Volume, and Moving Averages (MA). The strategy analyzes market data across multiple dimensions including momentum, volume, and price trends, generating buy signals when the market shows a clear upward trend confirmed by various technical indicators. The strategy employs strict screening conditions, requiring multiple indicators to simultaneously confirm before triggering trading signals to enhance accuracy.
Strategy Principles
The strategy bases trading decisions on the following core conditions: 1. RSI breaks above the 50 level, indicating momentum shift from weak to strong 2. Volume breaks above 20-period average, showing increased trading activity 3. Closing price above 14-period moving average, confirming short-term uptrend 4. Bullish engulfing pattern appears, indicating strong buying pressure 5. Price above 200-period moving average, confirming long-term uptrend The system generates a buy signal when all above conditions are met simultaneously. This multi-confirmation mechanism effectively reduces false signals and improves trading reliability.
Strategy Advantages
- Multi-dimensional analysis: Combines momentum, volume, and price trend indicators for comprehensive market evaluation
- Strict trading conditions: Requires multiple indicator confirmation to effectively filter false signals
- Trend-following characteristics: Captures both major trends and short-term opportunities through long-short term moving average combination
- Strong objectivity: Strategy based entirely on technical indicators, free from subjective judgment
- Easy to understand and execute: Clear strategy logic and explicit conditions facilitate practical operation
Strategy Risks
- Lag risk: Multiple technical indicators may lead to delayed signals, missing optimal entry points
- Range-bound market risk: Strategy may generate frequent false signals in consolidation phases
- Money management risk: Strategy lacks stop-loss and take-profit conditions, needs supplementation
- Market environment dependency: Strategy performs well in strong trend markets but may underperform in other market conditions
- Parameter optimization risk: Excessive parameter optimization may lead to overfitting historical data
Strategy Optimization Directions
- Add stop-loss and take-profit mechanisms: Suggest adding dynamic stop-loss and profit protection mechanisms for risk control
- Optimize parameter settings: Can optimize indicator periods through backtesting to improve strategy adaptability
- Add market environment filters: Incorporate market environment judgment mechanism to pause trading in unsuitable conditions
- Perfect exit mechanism: Design reasonable exit conditions to avoid premature or late exits
- Introduce position management: Dynamically adjust position size based on signal strength and market volatility
Summary
The strategy integrates multiple technical indicators to build a relatively complete trend-following trading system. The multi-confirmation mechanism helps improve trading reliability while introducing some lag. Through adding stop-loss and take-profit mechanisms, optimizing parameters, and incorporating market environment filters, the strategy’s practicality and stability can be further enhanced. Overall, this is a trading strategy with solid foundations and clear logic, offering good practical value and optimization potential.
/*backtest
start: 2019-12-23 08:00:00
end: 2024-11-28 08:00:00
period: 1d
basePeriod: 1d
exchanges: [{"eid":"Futures_Binance","currency":"BTC_USDT"}]
*/

//@version=5
strategy("Estratégia Completa - Volume, RSI e Tendência", overlay=true)

// Definir médias móveis
ma14 = ta.sma(close, 14)  // Média móvel de 14 períodos
ma200 = ta.sma(close, 200)  // Média móvel de 200 períodos

// Calcular o RSI de 14 períodos
rsi = ta.rsi(close, 14)

// Média de volume de 20 períodos
volumeMA = ta.sma(volume, 20)

// Condição para volume ser acima da média de 20 períodos
volumeAboveAvg = volume > volumeMA

// Condição para o RSI cruzar acima de 50
rsiCrossover50 = ta.crossover(rsi, 50)

// Condição para o fechamento estar acima da média de 14 períodos
closeAboveMA14 = close > ma14

// Condição para candlestick forte de alta (bullish engulfing)
bullishEngulfing = close > open and close[1] < open[1] and close > open[1]

// Condição para o preço estar acima da média de 200 períodos
priceAboveMA200 = close > ma200

// Condição de compra: todos os critérios precisam ser atendidos
buyCondition = volumeAboveAvg and rsiCrossover50 and closeAboveMA14 and bullishEngulfing and priceAboveMA200

// Executar a compra quando a condição for atendida
if (buyCondition)
    strategy.entry("Compra", strategy.long)

// Plotar as médias móveis no gráfico
plot(ma14, color=color.blue, linewidth=2, title="Média de 14 períodos")
plot(ma200, color=color.red, linewidth=2, title="Média de 200 períodos")

// Adicionar no gráfico o RSI
hline(50, "RSI 50", color=color.gray, linestyle=hline.style_dashed)
plot(rsi, color=color.green, linewidth=1, title="RSI (14)")

// Plotar a média de volume
plot(volumeMA, color=color.purple, linewidth=2, title="Média de Volume (20)")