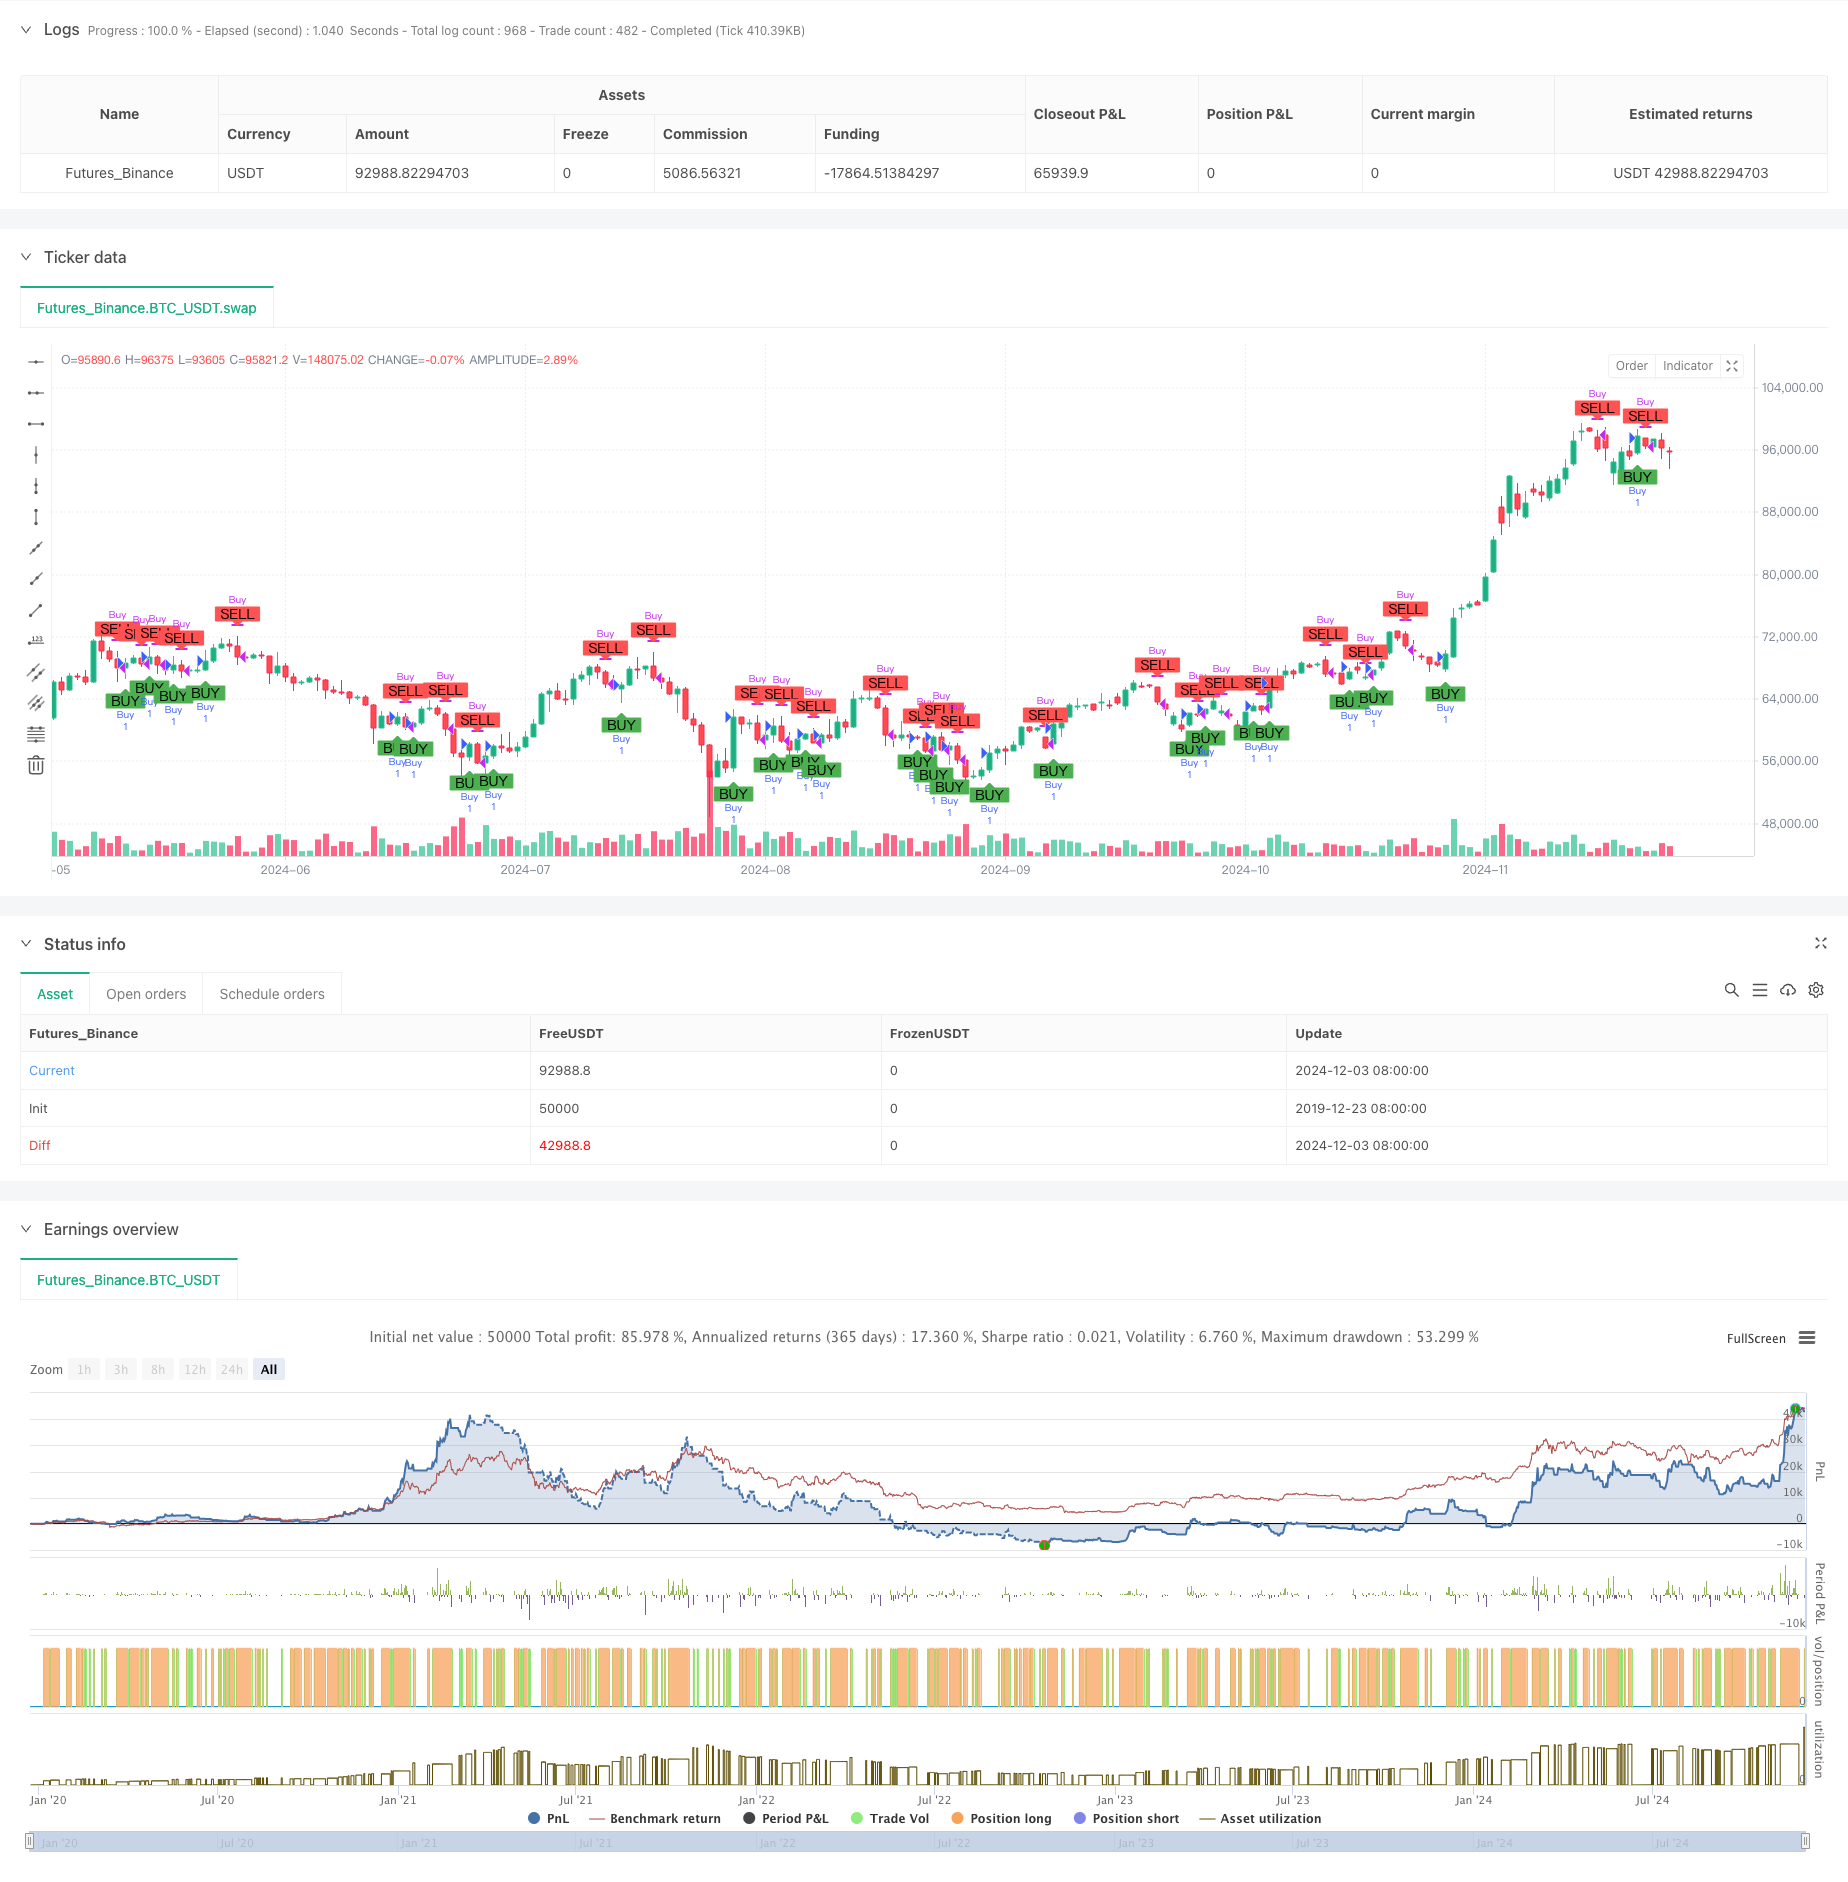
Overview
This strategy is a quantitative trading approach based on the crossover between the Detrended Price Oscillator (DPO) and its 4-period Exponential Moving Average (EMA). The core concept is to capture market trend changes by comparing the relationship between DPO and its 4-period EMA to generate buy and sell signals. The strategy is particularly effective on 4-hour and above timeframes, especially when using Heikin Ashi candles.
Strategy Principles
The core logic includes the following key steps: 1. Calculate 24-period Simple Moving Average (SMA) as the baseline 2. Shift the SMA forward by (length/2+1) periods to get the displaced SMA value 3. Subtract the displaced SMA from the closing price to obtain the DPO value 4. Calculate the 4-period EMA of the DPO 5. Generate buy signal when DPO crosses above its 4-period EMA 6. Generate sell signal when DPO crosses below its 4-period EMA
Strategy Advantages
- Clear Signal Generation: Cross-over signals provide clear entry and exit points, avoiding subjective judgment
- Effective Trend Following: DPO indicator effectively filters market noise for better trend capture
- Minimal Time Lag: Using short-period (4-period) EMA as signal line enables quick market response
- High Adaptability: Strategy shows consistent performance across different market conditions
- Simple Operation: Strategy logic is clear, easy to understand and execute
Strategy Risks
- Choppy Market Risk: May generate frequent false signals in sideways markets
- Lag Risk: Despite using short-period EMA, some inherent lag still exists
- Trend Reversal Risk: May incur significant losses during sudden trend reversals
- Parameter Sensitivity: Strategy performance is sensitive to period parameter selection
- Market Condition Dependency: Strategy may not perform optimally under certain market conditions
Strategy Optimization Directions
- Implement Volatility Filter: Add ATR or other volatility indicators to filter signals in low volatility environments
- Add Trend Confirmation: Incorporate other trend indicators like ADX to confirm trend strength
- Optimize Stop Loss: Dynamically adjust stop loss positions based on market volatility
- Improve Signal Filtering: Add volume confirmation or other technical indicators to filter false signals
- Parameter Adaptation: Implement dynamic parameter optimization to adapt to different market conditions
Summary
The DPO-EMA Trend Crossover Strategy is a structurally simple but effective quantitative trading strategy. By combining the detrended oscillator with moving averages, the strategy effectively captures market trend changes. While inherent risks exist, the strategy maintains practical value through proper optimization and risk management measures. For medium to long-term traders, this strategy represents a viable trading approach worth consideration.
/*backtest
start: 2019-12-23 08:00:00
end: 2024-12-04 00:00:00
period: 1d
basePeriod: 1d
exchanges: [{"eid":"Futures_Binance","currency":"BTC_USDT"}]
*/

//@version=5
strategy("DPO 4,24 Strategy", shorttitle="DPO Strategy", overlay=true)

// Define a fixed lookback period and EMA length
length = 24
ema_length = 4

// Calculate the Simple Moving Average (SMA) of the closing prices
sma = ta.sma(close, length)

// Calculate the shifted SMA value
shifted_sma = sma[length / 2 + 1]

// Calculate the Detrended Price Oscillator (DPO)
dpo = close - shifted_sma

// Calculate the 4-period Exponential Moving Average (EMA) of the DPO
dpo_ema = ta.ema(dpo, ema_length)

// Generate buy and sell signals based on crossovers
buy_signal = ta.crossover(dpo, dpo_ema)
sell_signal = ta.crossunder(dpo, dpo_ema)

// Overlay buy and sell signals on the candlestick chart
plotshape(series=buy_signal, location=location.belowbar, color=color.green, style=shape.labelup, text="BUY")
plotshape(series=sell_signal, location=location.abovebar, color=color.red, style=shape.labeldown, text="SELL")

// Strategy entry and exit conditions
if (buy_signal)
    strategy.entry("Buy", strategy.long)

if (sell_signal)
    strategy.close("Buy")