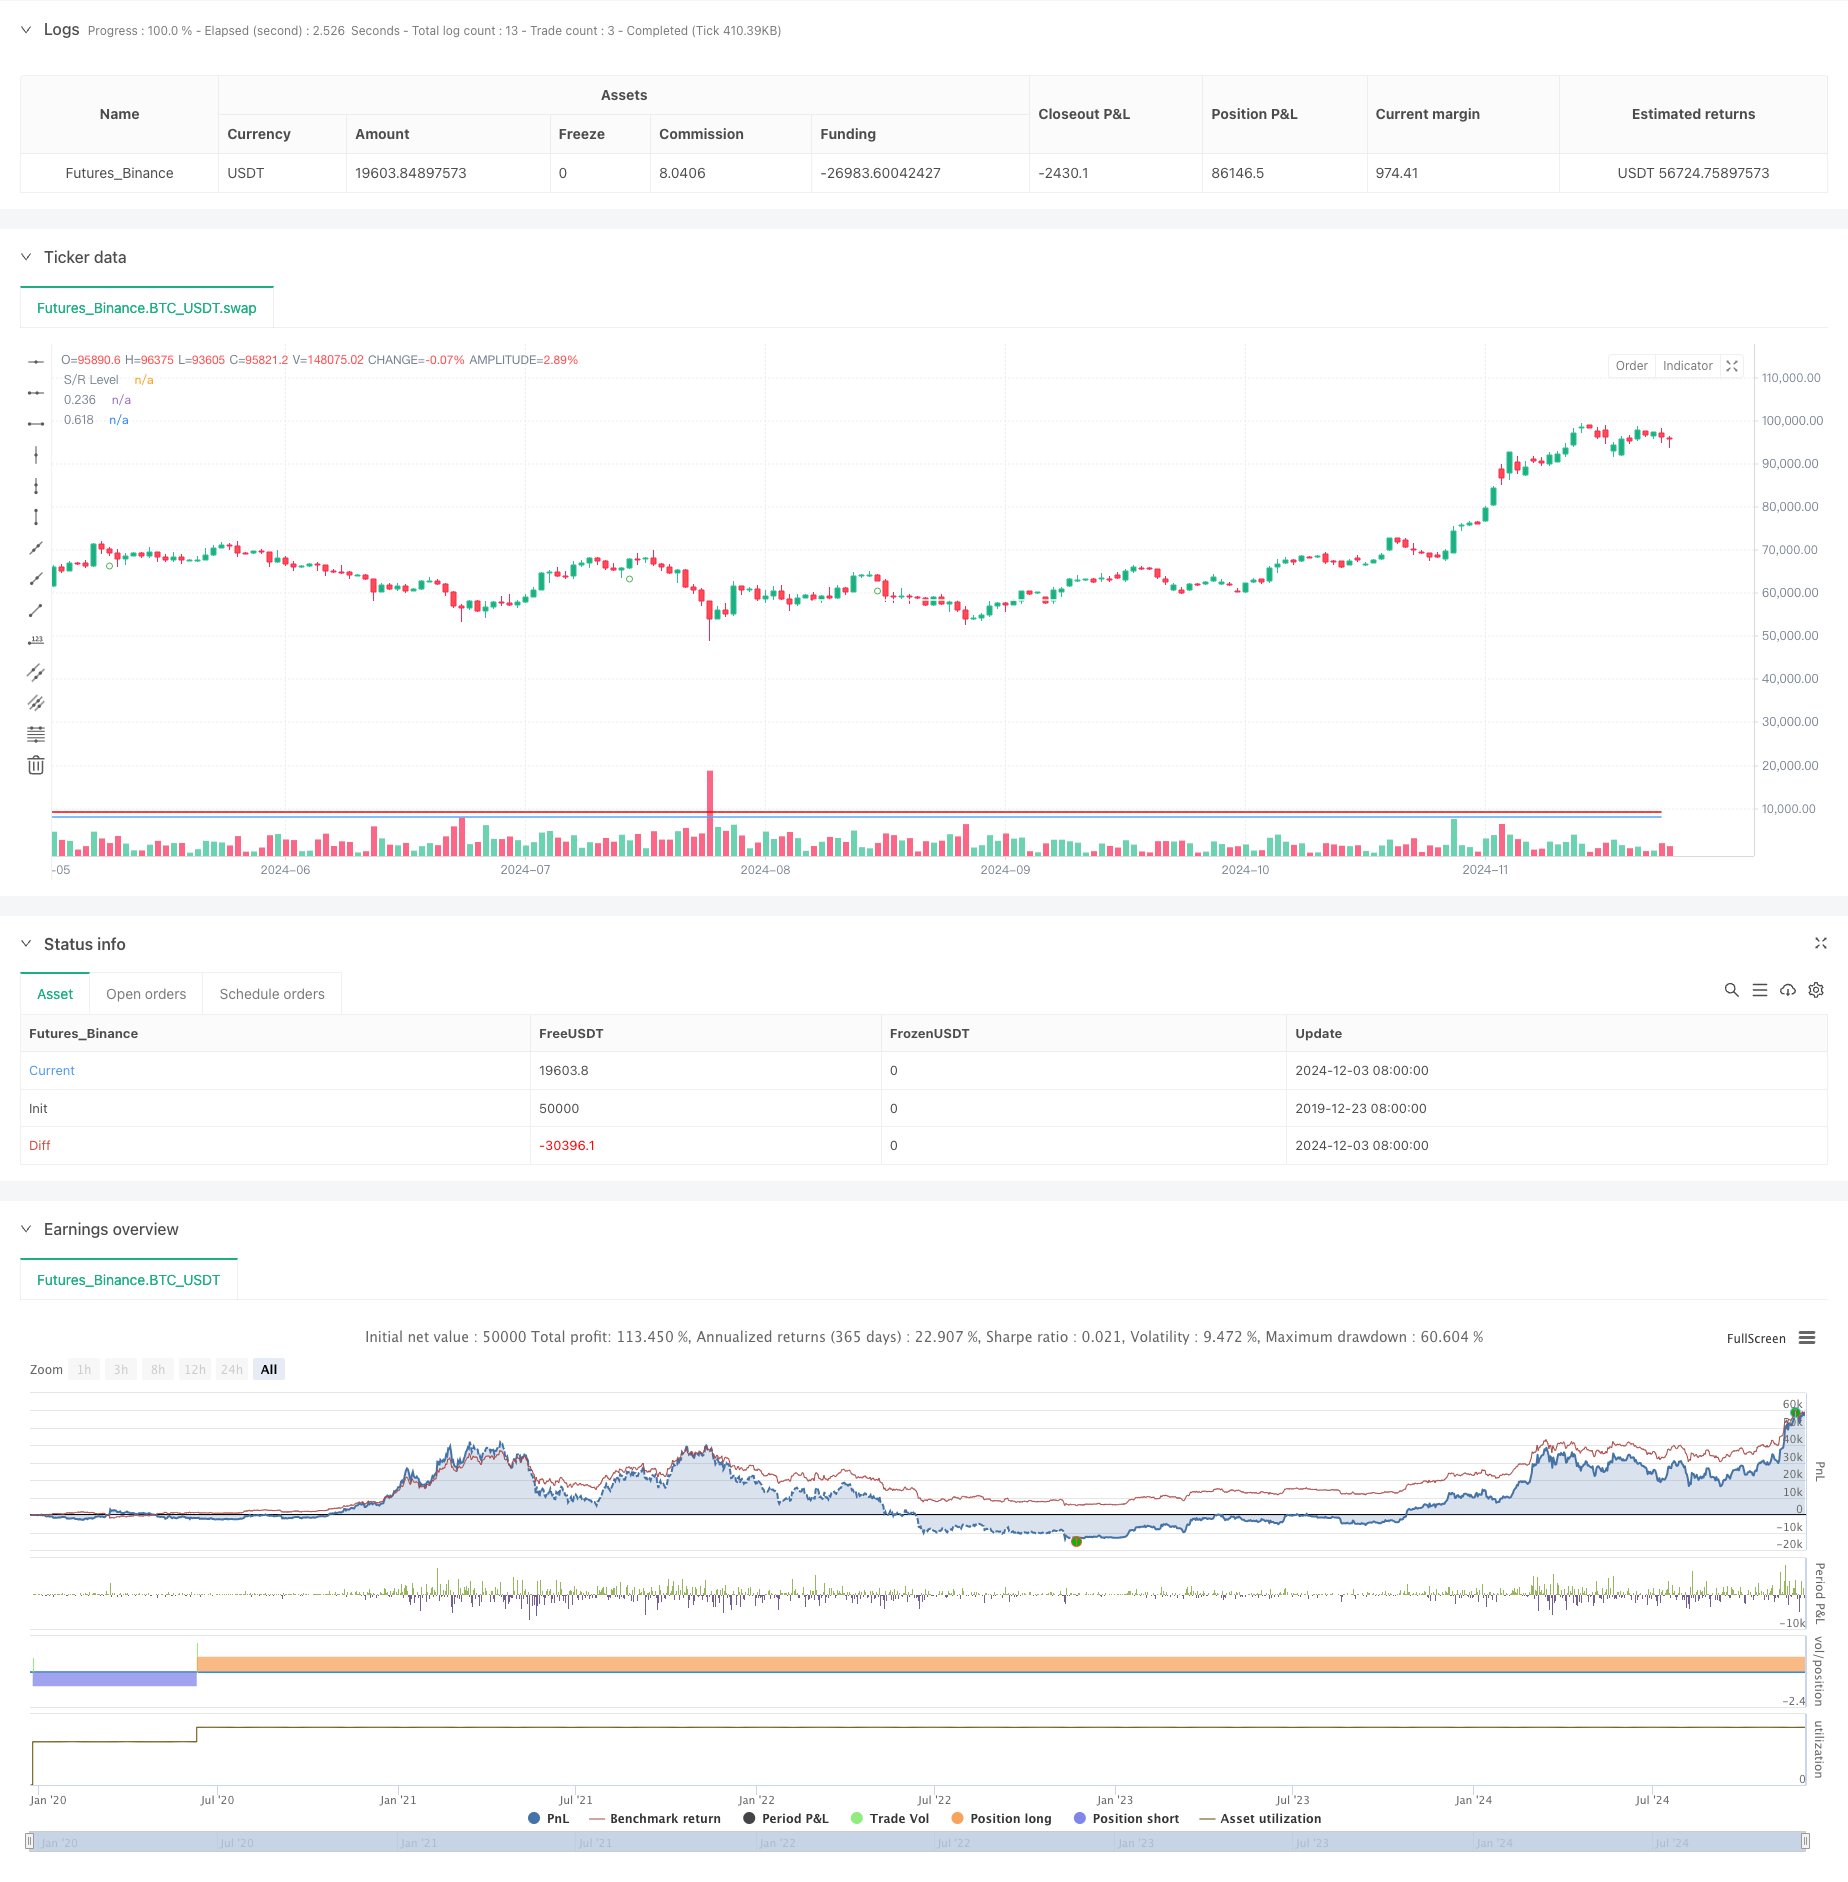
Overview
This is a comprehensive trading strategy system that combines multiple technical analysis pattern recognition with support and resistance levels. The strategy primarily works by identifying double bottom patterns (Adam and Eve bottoms), integrating Fibonacci retracement levels, and utilizing support and resistance lines for trading decisions. The core strength lies in its multi-dimensional technical indicator verification, which enhances the reliability of trading signals while using support and resistance levels as crucial references for risk control.
Strategy Principles
The strategy employs a triple verification mechanism for trading decisions: First, it identifies double bottom patterns through specific algorithms, including the sharper “Adam bottom” and the more rounded “Eve bottom”; Second, it uses Fibonacci retracement levels (0.618 and 1.618) to determine target zones; Finally, it confirms trading signals through support and resistance level verification. Trade signals are generated only when pattern recognition, Fibonacci levels, and support/resistance levels conditions are simultaneously met. Specifically, a long signal is triggered when the support/resistance level is above the 1.618 Fibonacci extension, while a short signal is triggered when the support/resistance level is below the 0.618 Fibonacci retracement.
Strategy Advantages
- Multiple verification mechanisms greatly enhance trading signal reliability
- Pattern recognition algorithms accurately capture market turning points
- Fibonacci levels provide precise target zones
- Support/resistance level verification increases trading safety
- Highly adjustable parameters adapt to different market conditions
- High degree of automation reduces subjective judgment bias
Strategy Risks
- Pattern recognition may have latency, affecting entry timing
- False signals may occur in highly volatile markets
- Support/resistance level effectiveness is influenced by market conditions
- Improper parameter settings may lead to overtrading
- Requires longer observation periods, potentially missing quick opportunities
Strategy Optimization Directions
- Introduce volatility indicators to filter market conditions
- Add trend filters to improve pattern recognition accuracy
- Optimize support/resistance level calculation methods
- Include volume indicators as confirmation
- Develop more flexible stop-loss and take-profit mechanisms
- Implement machine learning algorithms to enhance pattern recognition accuracy
Summary
This strategy constructs a relatively complete trading system by comprehensively utilizing multiple technical analysis methods including pattern recognition, Fibonacci levels, and support/resistance lines. Its strength lies in the high reliability provided by multiple verification mechanisms, while its adjustability allows adaptation to different market conditions. Although some inherent risks exist, through continuous optimization and improvement, the strategy shows promise for stable performance in actual trading. By incorporating additional technical indicators and optimization algorithms, there is significant room for performance enhancement.
/*backtest
start: 2019-12-23 08:00:00
end: 2024-12-04 00:00:00
period: 1d
basePeriod: 1d
exchanges: [{"eid":"Futures_Binance","currency":"BTC_USDT"}]
*/

//@version=5
strategy("Double Bottom with Support/Resistance Strategy - Aynet", overlay=true)

// Inputs
lookbackPeriod = input(21, "Lookback Period")
swingLowThreshold = input(1.5, "Swing Low Threshold")
fibLevel1 = input(0.618, "Fibonacci Level 1")
fibLevel3 = input(1.618, "Fibonacci Level 2")
srPeriod = input(21, "Support/Resistance Period")
srThreshold = input(3, "Support/Resistance Touch Points")

// Support/Resistance Function
get_sr_level(idx) =>
    var level = 0.0
    var count = 0

    if bar_index % srPeriod == 0
        highCount = 0
        lowCount = 0
        for i = 0 to srPeriod - 1
            if math.abs(high[i] - high) < (high * 0.001)
                highCount += 1
            if math.abs(low[i] - low) < (low * 0.001)
                lowCount += 1

        if highCount >= srThreshold
            level := high
            count := highCount
        if lowCount >= srThreshold
            level := low
            count := lowCount

    [level, count]

// Pattern Detection Functions
isSwingLow(src, left, right) =>
    isLow = true
    for i = 0 to left + right
        if src[i] < src[right]
            isLow := false
    isLow

getSpikeSharpness(index) =>
    priceRange = high[index] - low[index]
    bodyRange = math.abs(close[index] - open[index])
    sharpness = priceRange / bodyRange
    sharpness

// Pattern Variables
var float firstBottom = na
var float secondBottom = na
var bool isAdam = false
var bool isEve = false
var float level1Value = na
var float level3Value = na

// Pattern Detection
bottom = isSwingLow(low, lookbackPeriod, lookbackPeriod)
if bottom
    sharpness = getSpikeSharpness(0)
    if na(firstBottom)
        firstBottom := low
        isAdam := sharpness > swingLowThreshold
    else if low <= firstBottom * 1.02 and low >= firstBottom * 0.98
        secondBottom := low
        isEve := sharpness <= swingLowThreshold

// Calculate Fibonacci
if not na(secondBottom)
    highPoint = ta.highest(high, lookbackPeriod)
    fibDistance = highPoint - math.min(firstBottom, secondBottom)
    level1Value := math.min(firstBottom, secondBottom) + fibDistance * fibLevel1
    level3Value := math.min(firstBottom, secondBottom) + fibDistance * fibLevel3

// Get S/R Level
[srLevel, srCount] = get_sr_level(0)

// Trading Logic
longCondition = srLevel > level3Value
shortCondition = srLevel < level1Value

if longCondition
    strategy.entry("Long", strategy.long)

if shortCondition
    strategy.entry("Short", strategy.short)

// Reset Pattern
if high > ta.highest(high[1], lookbackPeriod)
    firstBottom := na
    secondBottom := na
    isAdam := false
    isEve := false
var table logo = table.new(position.top_right, 1, 1)
table.cell(logo, 0, 0, 'Double Bottom with Support/Resistance Strategy - Aynet', text_size=size.large, text_color=color.white)
// Plots
plot(level1Value, "0.236", color=color.rgb(245, 0, 0), style=plot.style_line)
plot(level3Value, "0.618", color=color.rgb(82, 166, 255), style=plot.style_line)
plot(srLevel, "S/R Level", color=color.white)

plotshape(bottom and not na(firstBottom) and na(secondBottom), "Adam Bottom", shape.circle, location.belowbar, color.green)
plotshape(bottom and not na(secondBottom), "Eve Bottom", shape.circle, location.belowbar, color.yellow)