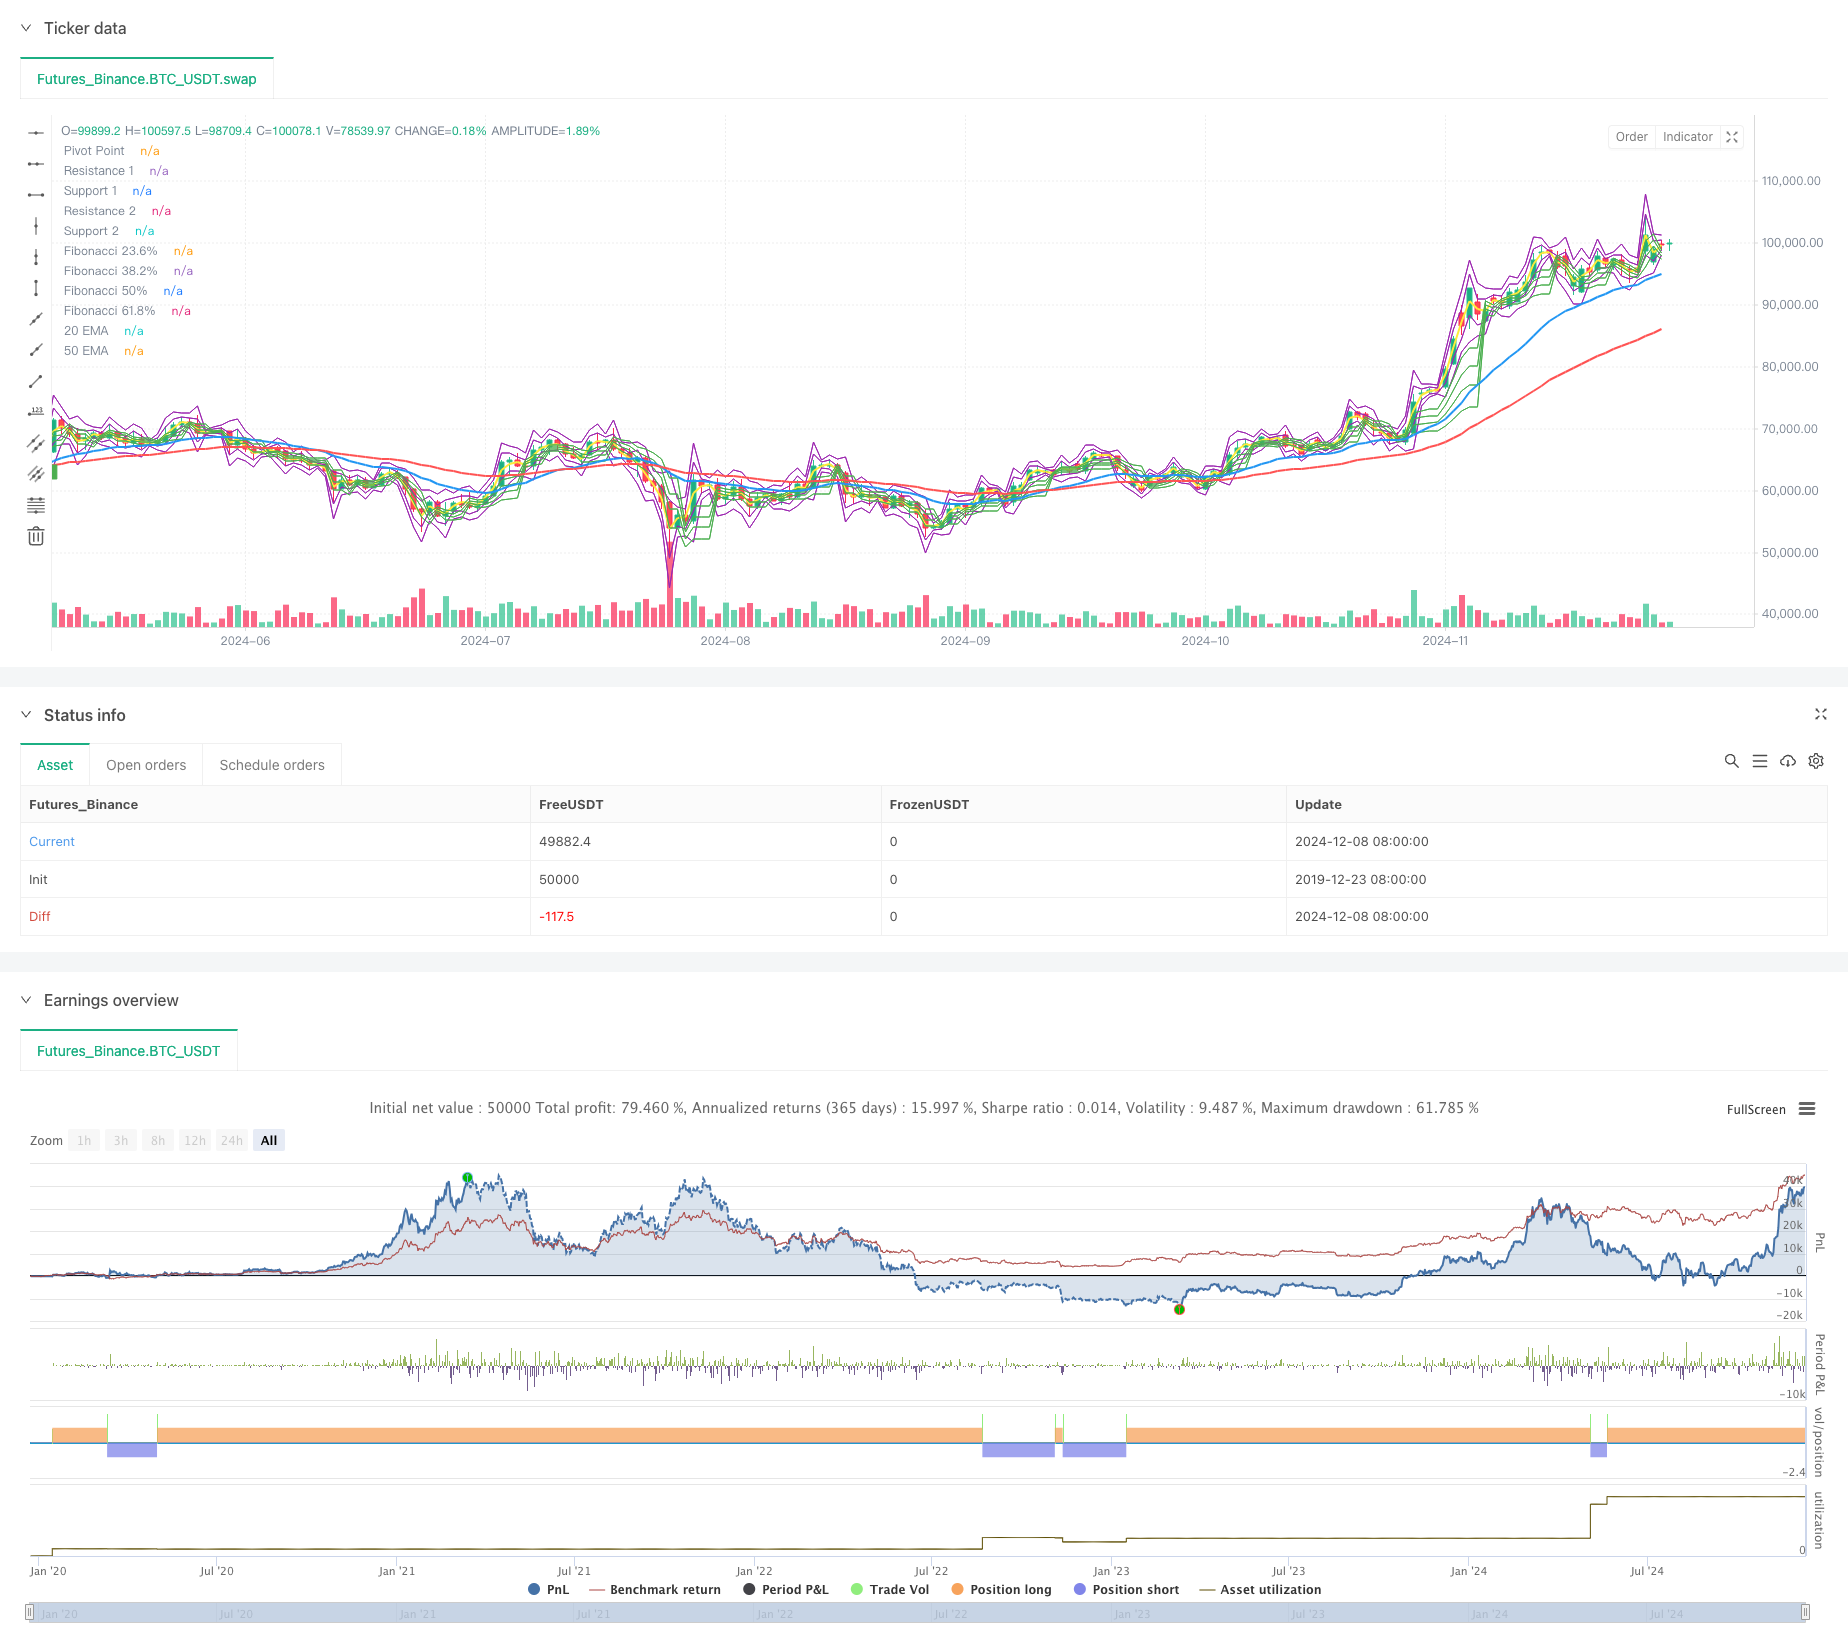
Overview
This strategy is a comprehensive trading system that combines multiple technical analysis tools, primarily utilizing dual EMAs (20⁄50 periods), Fibonacci retracement levels, and pivot point support/resistance levels to generate trading signals. The strategy adopts a combination of trend following and price retracement methods to enhance trading accuracy through multiple confirmations.
Strategy Principles
The core logic of the strategy is based on the following key elements: 1. Uses 20 and 50-period EMA crossovers to determine overall trend direction 2. Employs Fibonacci retracement levels (23.6%, 38.2%, 50%, 61.8%) to identify potential support/resistance levels 3. Integrates Pivot Points (PP) and their support/resistance levels (S1/S2, R1/R2) to confirm key price levels 4. Entry conditions must simultaneously satisfy: - Short-term EMA crosses above long-term EMA (for longs) or below (for shorts) - Price is above/below appropriate Fibonacci levels - Price confirms pivot point support/resistance levels 5. Implements fixed stop-loss (30 pips) and take-profit (60 pips) for risk management
Strategy Advantages
- Multiple technical indicator cross-validation improves signal reliability
- Combines trend and support/resistance for balanced entry timing
- Fixed risk management parameters facilitate quantitative execution
- Visualized trading signals enable real-time monitoring
- Suitable for medium to long-term trend trading, reducing short-term volatility impact
Strategy Risks
- Multiple indicators may lead to lagging signals, affecting entry timing
- Fixed stop-loss and take-profit levels may not suit all market conditions
- May generate excessive false signals in ranging markets
- Requires significant price movements for optimal returns
- Stop-losses may be ineffective during sharp market movements
Strategy Optimization Directions
- Introduce volatility-adaptive stop-loss and take-profit mechanisms
- Add volume indicators for additional confirmation
- Dynamically adjust EMA parameters based on market conditions
- Implement trend strength filters to reduce false signals
- Develop smarter partial position management mechanisms
Summary
This strategy integrates multiple classic technical analysis tools to build a relatively complete trading system. While it has some inherent lag, the multiple confirmation mechanism enhances trading reliability. Through the implementation of optimization suggestions, the strategy has potential for improved performance in live trading. It is recommended to conduct thorough backtesting and adjust parameters according to specific market characteristics before live deployment.
/*backtest
start: 2019-12-23 08:00:00
end: 2024-12-09 08:00:00
period: 1d
basePeriod: 1d
exchanges: [{"eid":"Futures_Binance","currency":"BTC_USDT"}]
*/

//@version=5
strategy("Forex Strategy with EMA, Pivot, Fibonacci and Signals", overlay=true)

// Input for EMAs and Pivot Points
emaShortPeriod = input.int(20, title="Short EMA Period", minval=1)
emaLongPeriod = input.int(50, title="Long EMA Period", minval=1)
fibRetraceLevel1 = input.float(0.236, title="Fibonacci 23.6% Level")
fibRetraceLevel2 = input.float(0.382, title="Fibonacci 38.2% Level")
fibRetraceLevel3 = input.float(0.5, title="Fibonacci 50% Level")
fibRetraceLevel4 = input.float(0.618, title="Fibonacci 61.8% Level")

// Function to calculate Pivot Points and Levels
pivot(high, low, close) =>
    pp = (high + low + close) / 3
    r1 = 2 * pp - low
    s1 = 2 * pp - high
    r2 = pp + (high - low)
    s2 = pp - (high - low)
    [pp, r1, s1, r2, s2]

// Calculate Pivot Points
[pp, r1, s1, r2, s2] = pivot(high, low, close)

// Calculate 20 EMA and 50 EMA
emaShort = ta.ema(close, emaShortPeriod)
emaLong = ta.ema(close, emaLongPeriod)

// Plot the EMAs
plot(emaShort, color=color.blue, title="20 EMA", linewidth=2)
plot(emaLong, color=color.red, title="50 EMA", linewidth=2)

// Fibonacci Levels (manually drawn between the most recent high and low)
var float fibHigh = na
var float fibLow = na

if (not na(high[1]) and high > high[1])  // Check if new high is formed
    fibHigh := high
if (not na(low[1]) and low < low[1])    // Check if new low is formed
    fibLow := low

fib23_6 = fibLow + (fibHigh - fibLow) * fibRetraceLevel1
fib38_2 = fibLow + (fibHigh - fibLow) * fibRetraceLevel2
fib50 = fibLow + (fibHigh - fibLow) * fibRetraceLevel3
fib61_8 = fibLow + (fibHigh - fibLow) * fibRetraceLevel4

plot(fib23_6, color=color.green, linewidth=1, title="Fibonacci 23.6%")
plot(fib38_2, color=color.green, linewidth=1, title="Fibonacci 38.2%")
plot(fib50, color=color.green, linewidth=1, title="Fibonacci 50%")
plot(fib61_8, color=color.green, linewidth=1, title="Fibonacci 61.8%")

// Entry conditions (Crossovers)
longCondition = ta.crossover(emaShort, emaLong) and close > fib23_6 and close > s1
shortCondition = ta.crossunder(emaShort, emaLong) and close < fib23_6 and close < r1

// Exit conditions (Stop Loss and Take Profit)
stopLossPips = 30 * syminfo.mintick  // 30 pips Stop Loss
takeProfitPips = 60 * syminfo.mintick // 60 pips Take Profit

if (longCondition)
    strategy.entry("Buy", strategy.long, stop=stopLossPips, limit=takeProfitPips)
if (shortCondition)
    strategy.entry("Sell", strategy.short, stop=stopLossPips, limit=takeProfitPips)

// Plot Pivot Points for visual reference
plot(pp, color=color.yellow, linewidth=2, title="Pivot Point")
plot(r1, color=color.purple, linewidth=1, title="Resistance 1")
plot(s1, color=color.purple, linewidth=1, title="Support 1")
plot(r2, color=color.purple, linewidth=1, title="Resistance 2")
plot(s2, color=color.purple, linewidth=1, title="Support 2")

// Adding Buy and Sell Signals
plotshape(longCondition, title="Buy Signal", location=location.belowbar, color=color.green, style=shape.labelup, text="BUY", textcolor=color.white, size=size.small)
plotshape(shortCondition, title="Sell Signal", location=location.abovebar, color=color.red, style=shape.labeldown, text="SELL", textcolor=color.white, size=size.small)