Overview
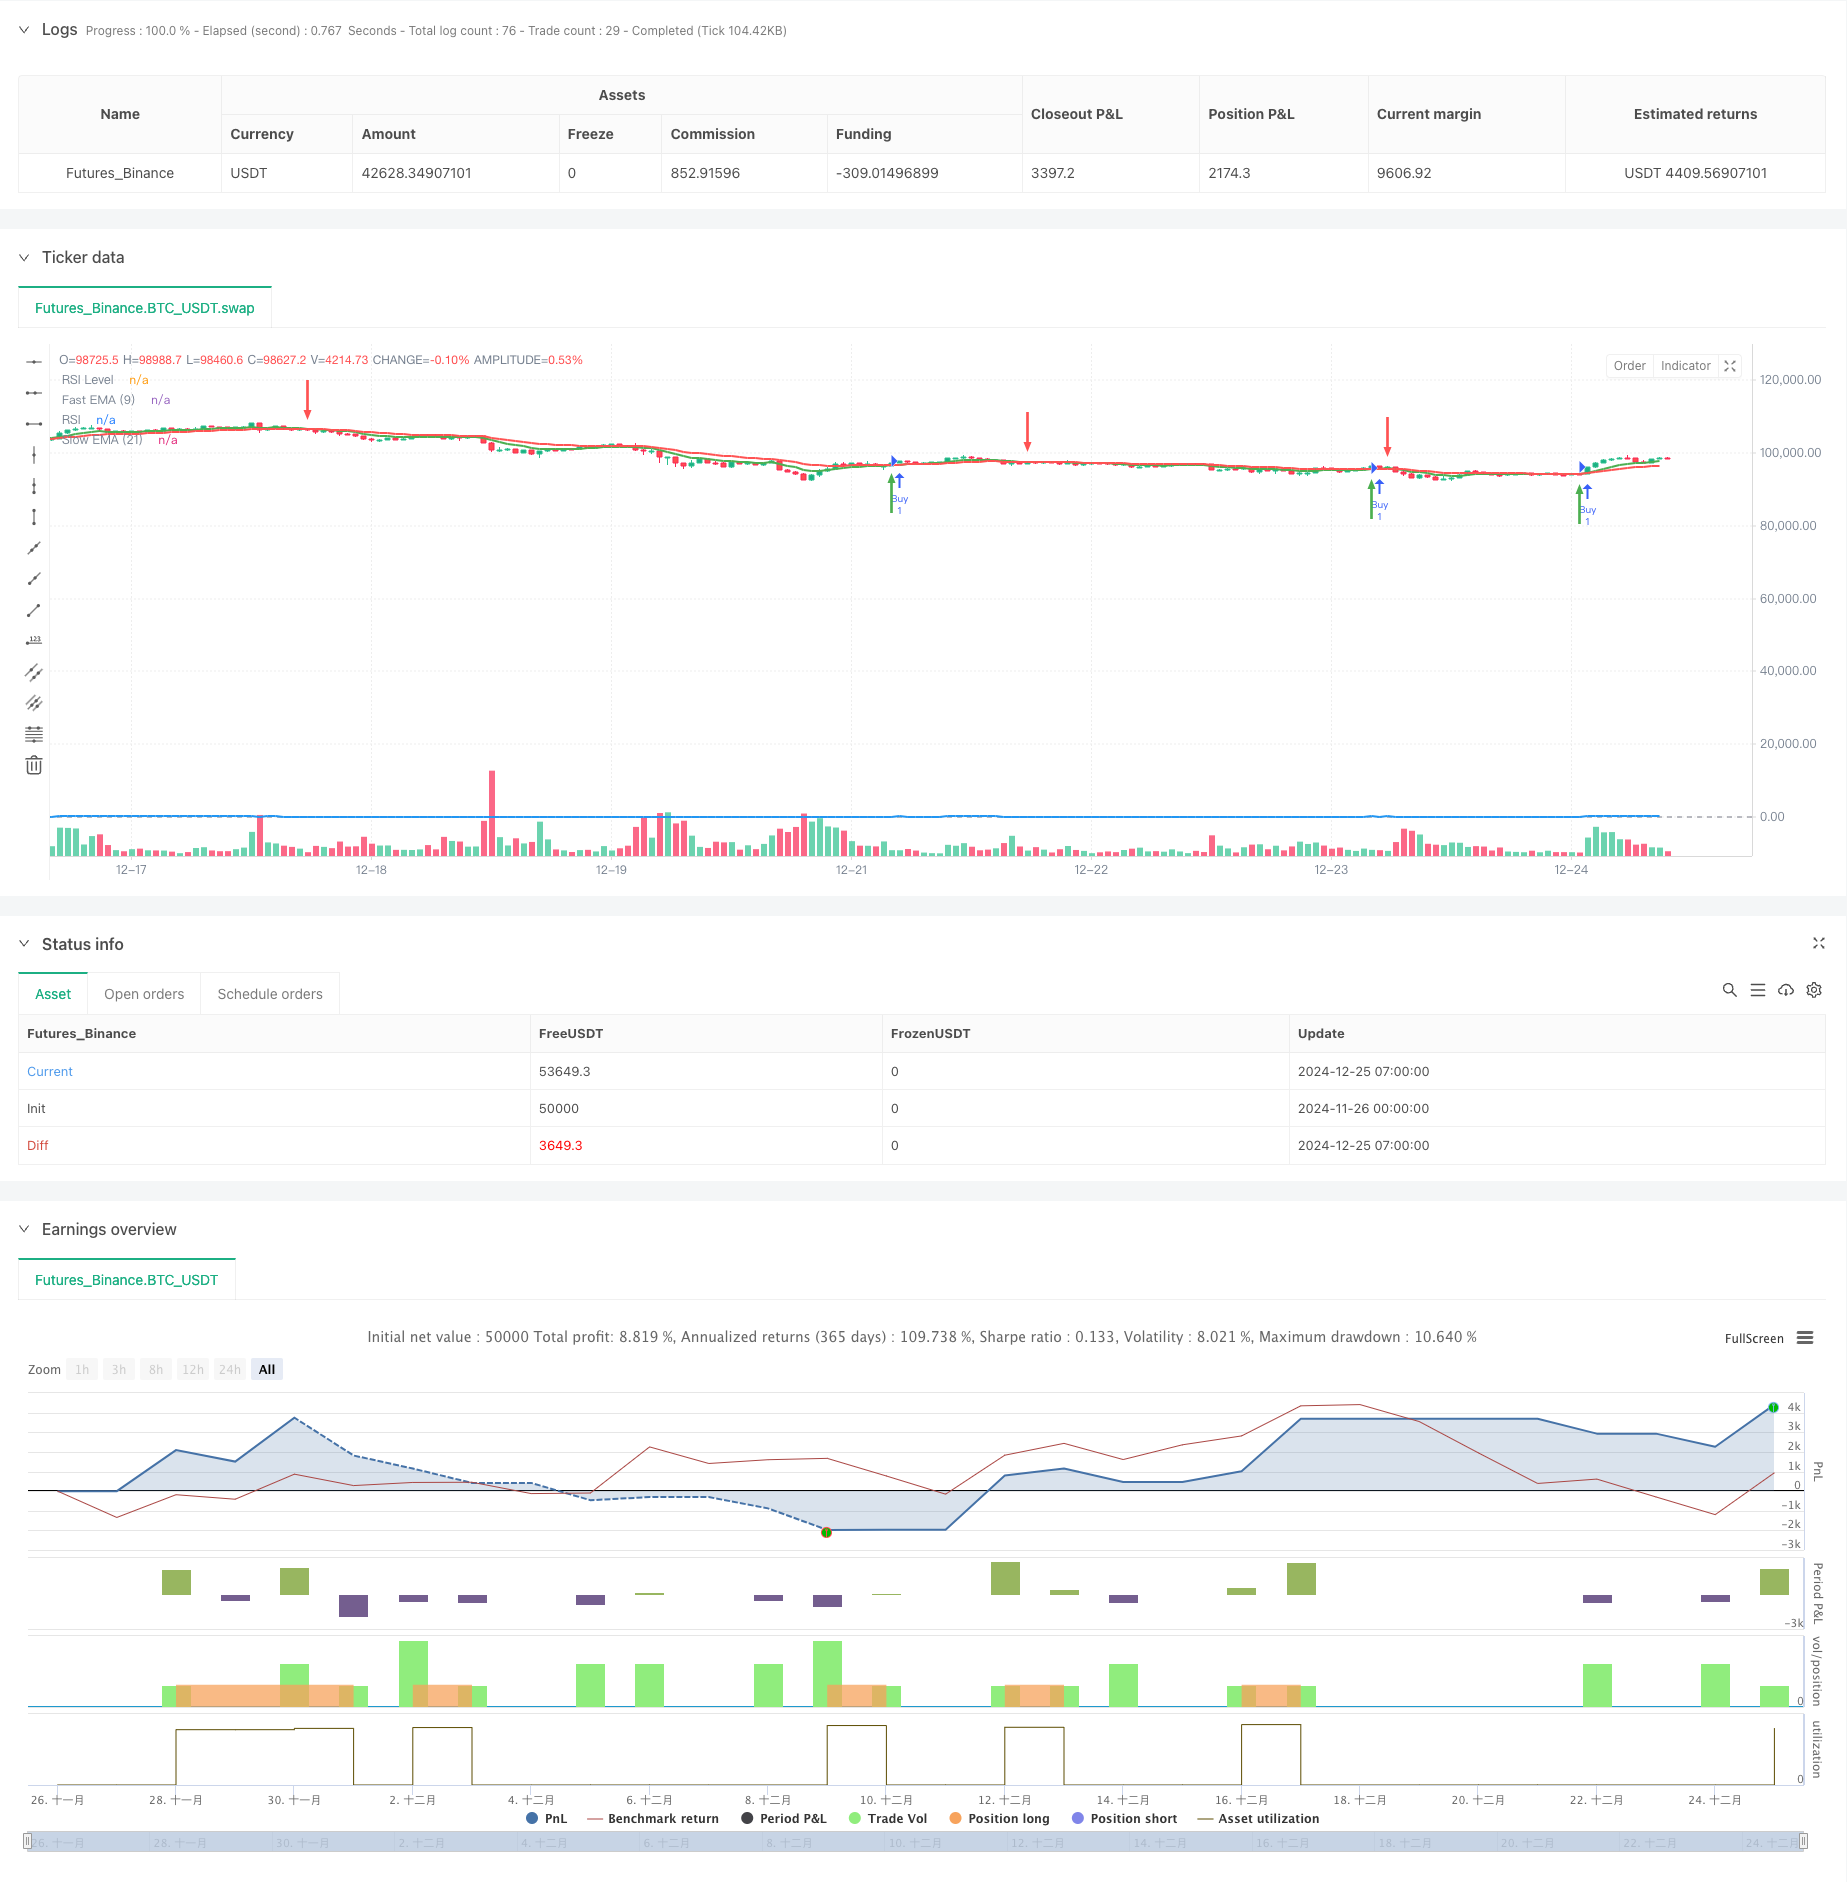
This strategy is a trend reversal trading system that combines Exponential Moving Averages (EMA) and Relative Strength Index (RSI). It identifies trend reversal points through the crossover signals of 9-period and 21-period EMAs, confirmed by RSI breakthroughs at the 50 level. The system includes a comprehensive risk management mechanism with fixed risk-reward ratios to effectively control drawdowns.
Strategy Principle
The core logic is based on the crossover between Fast EMA (9-period) and Slow EMA (21-period), with momentum confirmation from RSI. The system generates a buy signal when the Fast EMA crosses above the Slow EMA while RSI is above 50, and a sell signal when the Fast EMA crosses below the Slow EMA while RSI is below 50. EMA crossovers capture price trend changes, while RSI filters out false breakouts to improve signal quality. The system also incorporates a risk-reward based stop-loss and take-profit mechanism for risk management.
Strategy Advantages
- Dual confirmation mechanism: Combines EMA crossovers and RSI confirmation to significantly reduce false signals
- Clear visualization: Uses green and red arrows to mark entry and exit points, making trading signals intuitive
- Comprehensive risk management: Built-in stop-loss and take-profit functions with adjustable risk-reward ratios
- High adaptability: Core parameters can be adjusted to suit different market conditions and trading instruments
- Simple execution: Clear trading rules suitable for automated trading systems
Strategy Risks
- Poor performance in sideways markets: May generate frequent false signals during range-bound conditions
- Lag risk: Moving averages have inherent lag, potentially missing optimal entry points
- RSI misjudgment: RSI indicators may generate misleading signals in extreme market conditions
- Parameter sensitivity: Different market environments may require parameter adjustments, increasing maintenance costs Solutions: Recommended for use in clear trending markets, consider adding ATR for volatility filtering, and combine with longer-term trend analysis.
Strategy Optimization Directions
- Implement volatility filtering: Add ATR indicator to suspend trading in low volatility environments
- Optimize stop-loss/take-profit: Consider dynamic stop-loss methods like trailing stops or ATR-based stops
- Add trend strength filtering: Incorporate longer-term trend indicators to trade only in the main trend direction
- Enhance volume confirmation: Add volume analysis to improve signal reliability
- Market environment classification: Dynamically adjust parameters based on different market conditions
Summary
This strategy builds a robust trend-following system by combining EMA crossovers and RSI momentum confirmation. Its comprehensive risk control mechanism and clear visualization interface make it highly practical. While performance may be suboptimal in sideways markets, the suggested optimization directions offer potential for further improvement. Traders are advised to conduct thorough backtesting and adjust parameters according to specific trading instrument characteristics before live implementation.
/*backtest
start: 2024-11-26 00:00:00
end: 2024-12-25 08:00:00
period: 1h
basePeriod: 1h
exchanges: [{"eid":"Futures_Binance","currency":"BTC_USDT"}]
*/

//@version=5
strategy("EMA Crossover with RSI Confirmation and Buy/Sell Signals", overlay=true)

// Input for EMAs and RSI
fastLength = input.int(9, title="Fast EMA Length")
slowLength = input.int(21, title="Slow EMA Length")
rsiLength = input.int(14, title="RSI Length")
rsiLevel = input.int(50, title="RSI Level", minval=0, maxval=100)

// Calculate the EMAs and RSI
fastEMA = ta.ema(close, fastLength)
slowEMA = ta.ema(close, slowLength)
rsi = ta.rsi(close, rsiLength)

// Plot the EMAs on the chart
plot(fastEMA, color=color.green, linewidth=2, title="Fast EMA (9)")
plot(slowEMA, color=color.red, linewidth=2, title="Slow EMA (21)")

// Plot the RSI on a separate pane (below the chart)
hline(rsiLevel, "RSI Level", color=color.gray)
plot(rsi, color=color.blue, linewidth=2, title="RSI")

// Buy condition: Fast EMA crosses above Slow EMA and RSI crosses above 50
buyCondition = ta.crossover(fastEMA, slowEMA) and rsi > rsiLevel

// Sell condition: Fast EMA crosses below Slow EMA and RSI crosses below 50
sellCondition = ta.crossunder(fastEMA, slowEMA) and rsi < rsiLevel

// Execute trades based on conditions
if (buyCondition)
    strategy.entry("Buy", strategy.long)
    label.new(bar_index, low, "Buy", color=color.green, textcolor=color.white, style=label.style_label_up, size=size.small)

if (sellCondition)
    strategy.close("Buy")
    label.new(bar_index, high, "Sell", color=color.red, textcolor=color.white, style=label.style_label_down, size=size.small)

// Strategy exit (optional): Fixed risk-to-reward ratio (take profit and stop loss)
takeProfit = input.int(2, title="Take Profit (Risk-Reward)", minval=1)
stopLoss = input.int(1, title="Stop Loss (Risk-Reward)", minval=1)

strategy.exit("Exit Buy", "Buy", stop=close * (1 - stopLoss / 100), limit=close * (1 + takeProfit / 100))

// Plot buy/sell arrows for visualization
plotarrow(buyCondition ? 1 : na, offset=-1, colorup=color.green, maxheight=30, title="Buy Signal Arrow")
plotarrow(sellCondition ? -1 : na, offset=-1, colordown=color.red, maxheight=30, title="Sell Signal Arrow")